


CL Hawk Baseball & What Could Have Been with Season Stats
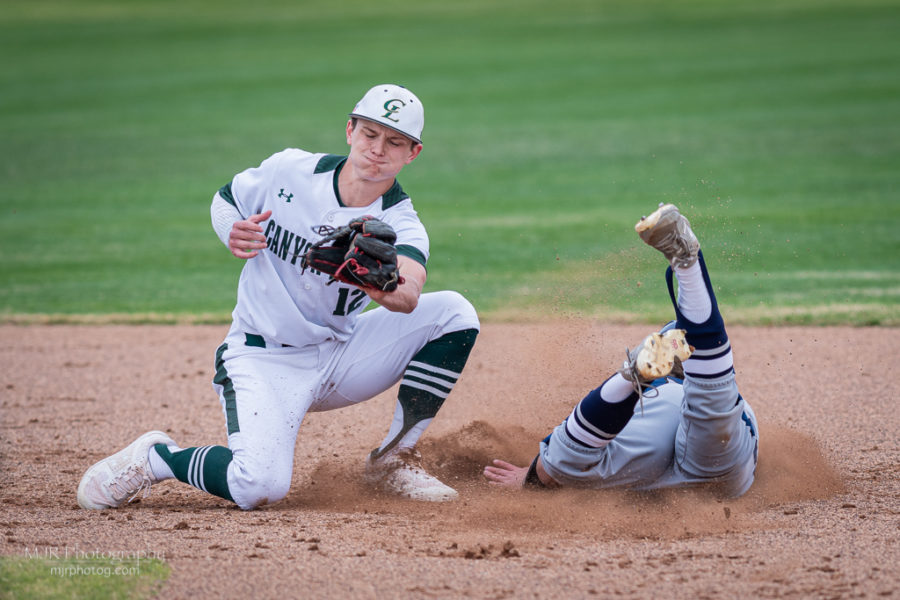
Caleb Williams and Hawks finished season with a .962 Fielding Percentage.
rr[Photo Credit: Mark Robinson / MJR Photography / www.mjrphotog.com]
First off The ReSporter will start off with the team stats to help put in perspective how this Hawk team compared to past Canyon Lake teams. With a caveat for the future as The ReSporter has both Varsity and Junior Varsity season stats.

Signature Homes says, Go Hawks!
Both clubs were at the top of their game this year and looking at the Varsity below will show just how lethal this team might have been in those district battles that were left out on the China Wuhan Wall.
This officially finished 2020 season had this group of young men holding the best in several categories when compared to previous Hawk teams.
These stats are not based on the most times a team had a *hit (*substitute: Runs, Strikeouts (SO), Base on Balls (BB), etc.) during a season but what those numbers averaged for a game which would be a better indicator. Especially after a shortened campaign.
Also notice the number of games shown for this season is 19 and not 14 as The ReSporter has already implemented this year’s exhibition numbers to help the team and Seniors. Many of those players, would have had a chance of reaching past players final stats, if the season would not have been halted by what China did to the world by spreading this Wuhan Virus around the world.
                            Here are the Top 3 Years in each standard.

                       Batting Average    On Base Percentage       Slugging Percentage
         1) 2020            .286          2020        .427         2009         .397
         2) 2009            .283          2009        .394         2020         .365
         3) 2019            .269          2019        .386         2019         .350

                   @ Bats  # Ga  Ave            Runs   # Ga  Ave          Hits  # Ga   Ave
         1) 2020     496   19    26.1     2020   125   19    6.6   2020   142   19     7.5
         2) 2009     534   22    24.3     2009   122   22    5.6   2009   151   22     6.9
         3) 2010     680   29    23.4     2019   114   26    4.9   2019   163   26     6.3

                   RBI’s   # Ga  Ave              BB   # Ga  Ave          SO    # Ga   Ave
         1) 2020      65   19    4.6      2020    94   19    4.9   2010   145   29     5.0
         2) 2009      92   22    4.2      2011    93   24    3.9   2020   106   19     5.6
         3) 2019      92   26    3.5      2009    85   22    3.8   2011   141   24     5.9

            Defense categories are the number of runs/hits, etc allowed for a season.
                    Runs    # Ga Ave      Hits # Games Ave                SO     # Ga  Ave
         1) 2020      44   19    2.3      2020    70   19    3.7   2020   146   19     7.7
         2) 2010     123   29    4.2      2010   130   29    4.5   2009   133   22     6.0
         3) 2019     133   26    5.1      2011   176   24    7.3   2018   123   28     4.4

            Earned Run                    Average Fielding
         1) 2020    0.94                  2020       .964
         2) 2019    3.75                  2019       .928
         3) 2010    4.37                  2018       .904
You can see how this team dominated those previous CL Team starting with that 2009 season to present. The Hawk, Pitching, Fielding and Hitting was on top in almost every item this season.

Let’s Go Hawks!!
In fact, in many cases, so far ahead that you can imagine how far this team might have reached, when the post-season came calling.
As an example, look at this season’s final era number (0.94) and even if CL had played a pansy schedule, which they didn’t, would be hard to have for one pitcher much less a whole staff.
The ReSporter looked at one of the Top 25 Polls that was published before this Wuhan Virus stopped action in March. What was found, out of those 25 teams was striking, Canyon Lake topped all but one team in playing a tougher schedule based on win/loss records.
The Lake was not part of that poll, telling you just how tough it would be to know every team in this Great State of Texas, and being able to craft a poll without leaving schools out of that fray. Which was the case for your Home Town Boys.
Those teams were ranked based on how well they finished last year’s games and if a Pollster made a different, then it would only be based on their proximity to their geographical area.

Go Hawks!!
Another avenue The ReSporter took in comparing District 28-4A teams was by using a metric that would compare each team’s pitching staff. This would help in finding out which school had the best pitching staff.
Baseball can be won with good hitting or fielding but if a team has a consistent pitching staff, then those first two (hitting & fielding) do not have to be perfect for a team to finish a game with a win. Another tidbit is knowing that when it is time for district play to begin, a team can assess how well they might finish based on having two quality pitchers.
So, The ReSporter, went through each teams games and found that all the schools had played in 3 tournaments and going on an assumption that the first game a school will use their Ace Pitcher and that would be the case on down the road as the tournament would continue.
So the first game had the No. 1 pitcher, game two would have No.2 player, then a third game would pit each schools No. 3 pitcher.
Another variable was used where The ReSporter gave a ranking to each team being played and divided those schools with a (1) meaning a top notch school, (2) an average school, and (3) being a team that would be losing by a bunch and the game is usually stopped by the, ‘run rule’.
On that first game, CL finished with a 3-0 record for those first games of each tournament. Llano had the same record. The Hawks 1-2-3 opponent strength was a 6 while Llano added up to an 8, giving you an idea that CL played a tougher group of teams to start each tournament. A number that showed 9 would be an all patsy schedule and a 3 would tell a you that team played good teams and/or larger schools.
Here are the Teams based on that 1st Game of each Tourney:
           FIRST GAME of Tournament Best Pitchers (an assumption)
                               Record  Strength of Opp      Runs Scored and Runs Allowed
           Canyon Lake         3-0-0          6                 12              3
           Boerne              2-0-1          6                 17              6
           Llano               3-0-0          8                 27              7
           Wimberley           1-1-1          7                 14             15
           Fredericksburg      0-2-1          4                  8             16
           Bandera             1-2-0          7                 11              8

           SECOND GAME 2nd Best Pitcher                        Runs         Runs Allowed
           Canyon Lake         3-0-0          6                 13              5
           Llano               2-1-0          7                 30             11
           Boerne              1-1-1          6                  9             11
           Bandera             2-1-0          7                 13             18
           Wimberley           1-1-1          7                 15             17
           Fredericksburg      1-2-0          7                 11             29

           THIRD GAME 3rd Best Pitcher                         Runs         Runs Allowed
           Canyon Lake         3-0-0          7                 33              3
           Llano               1-0-1          4                 13             10
           Wimberley           2-1-0          8                 23             18
           Bandera             2-0-1          7                 20              7
           Fredericksburg      1-2-0          8                 15             20
           Boerne              0-2-0          4                  8             21
That speaks volumes on how lock-down CL’s pitching staff performed as those numbers were more impressive when they played a 4th-5th game. In those 3rd game scenarios, The Lake was at their best in scoring 33 runs while allowing only 3 tallies total.
Canyon City Grill says Go Hawks!
Simply put, Canyon Lake’s pitching staff did not have a weak link and those players were consistent which allowed the Hawks to finish their regular season with just two losses and both games by one run with each loss coming in the last inning when their opponent rallied and took a lead.
One loss was to a decent Medina Valley 5A school that Canyon Lake was allowed to play again that next week and had a, 7-1 victory. That other contest was against San Antonio Christian and this team was blessed with a lot of arms and finished their season with a, 15-0 record. The Hawks lost 3-2 with a chance for a win before running out of outs with players in scoring position when that game ended.
Yes, a lot of numbers but seeing how well your Hawks performed needs to be emphasized as this year would have been an excellent chance of making the finals in Region IV. This Region had 4 teams that were ranked in that Poll mentioned earlier.
Liberty Hill, Lampasas, Llano, and Sinton are those teams listed that would be good battles during the rounds of playoff battles, but all that can be done now is quit buying anything that is made in China and take what The ReSporter deduces, that the Hawks would have won District 28-4A without question.
Below is this season’s 2020 Season Stats and now we can only wait for next season for another chance of making noise. This season, Canyon Lake’s Junior Varsity finished their season, 12–3-1 and this team had some impressive outings.

Go Hawks and Get a Hit Next Year
CLJV had 4 district contests before the Wuhan break and those two schools were stalwarts, Fredericksburg and Boerne.
Your Hawks swept both teams and finished with a 4-0 district record. The Junior Varsity did not have a chance to match-up against Wimberley so this is incomplete, but this group of players are biting at the bit for get a chance to play Varsity next season.
Yes, more pitching and a ton of hitting and they have their final Season Stats below Varsity.
Canyon Lake has never had this many players in the pipeline inching up for a chance to show the Hawk Coaches what they can do….there were over 30 JV players that suited up and CL could have easily had two teams much like this past football season, when Canyon Lake had a Junior Varsity, Freshman, and Gold Team that all finished with winning records with the JV finishing 2nd while the Freshman and Gold team winning their District 28-4A Crown.
Good times are coming and The ReSporter will be ready when February comes calling again next season with a baseball team that will be ready to finish what was started.
Way to Go Hawks and Thanks Seniors.
VARSITY 2020       1  2  3  4  5  6  7  8  9 10    R   H   E
Opponent           6  8  0  3  4  7 10  2  4  0   46  70  45
CL Hawks (16-3)   20 18 20 16 26  5 10  1  0  1  125 142  38

                    ab   r   h  bi  2b 3b hr  bb  so  sb   ave  obp  slg  misc
Brandon Robinson    55  14  23  16   2  0  2   7   7   3  .418 .536 .564  hbp 7 sf roe 3 fc
Jeremy Greene        5   7   2   0   0  0  0   1   3   1  .400 .500 .400
James LaLonde       45  13  16  14   0  1  0   7   5   2  .356 .453 .400  hbp roe sac 3 fc 2
Kolton Ramey        16   4   5   3   1  0  0   0   3   0  .313 .476 .353  hbp 5 fc
Ty Sellers          45  14  14  10   2  0  0   4   6   6  .311 .367 .356  sf roe 4 fc 2
Tyler Pauly         42   9  13  10   2  0  0  18   5   2  .310 .525 .357  hbp fc 3 roe
Caleb Williams      61  15  18  16   2  2  2   6  15   1  .295 .377 .492  hbp 2 roe
Hayden Baker        17   5   5   0   0  0  0   3   3   0  .294 .400 .294
Ethan Slater        18  13   5   3   1  0  0   7   8   6  .278 .480 .333  sac
Mason Lee           40   8  10   6   2  0  0   6   9   2  .250 .388 .300  hbp 3 sf 2 roe
Tanner Schultz      54   8  13   8   4  0  1   4   5   0  .241 .317 .370  hbp 2 sac fc 2 roe 5 sf
Cale Claycomb       25   2   6   1   0  0  0   5  11   1  .240 .406 .240  hbp 2 sac 3 roe 3 fc 2
Hunter Anderson     19   5   4   2   0  0  0   3   8   1  .222 .318 .222  fc
Chase Anderson      21   2   4   4   1  0  0   5   5   1  .190 .346 .238  sac roe 3 fc
Matt Anderson       25   5   4   5   1  0  0  16   9   0  .160 .543 .200  hbp 5 sac 2 roe 2
Dalton Stanley       8   0   0   1   0  0  0   2   4   0  .000 .200 .000  sf
Peyton McMullen      0   1   0   0   0  0  0   0   0   0  .000 .000 .000
Totals             496 125 142  99  18  3  5  94 106  26  .286 .427 .365  hbp 28

Fielding: .964

Pitching            ip   h   r  er  bb  so   era   W  L  S
Tyler Pauly       35.0  13   3   1   8  42  0.20   5  0  0
Tanner Schultz    38.0  20   5   2   7  39  0.36   7  0  0
Cale Claycomb     15.2   9  10   3  17  28  1.38   2  0  0
Hunter Anderson    5.2   4   3   1   3   4  1.35   1  0  2
Matt Anderson     26.1  20  12   6  13  21  1.61   1  1  0
Peyton McMullen    6.2   2   8   4  10  11  4.52   0  1  0
Hayden Baker       2.0   2   3   2   6   1  7.00   0  0  0
Totals           127.1  70  44  17  64 146  0.94  16  3  2

++++++++++++++++++++++++++++++++++++++++++++++++++++++++++++++++++++++++++++++++++++

JUNIOR VARSITY

                1  2  3  4  5  6  7    R   H   E
Opposition      9  7 14 11  7  1  2   51  40  42
CL Hawks JV    33 43 14 34 15  2  1  142 107  31

                    ab   r   h  bi 2b 3b hr  bb  so   ave   obp   slg  misc
Dalton Stanley       1   1   1   0  0  0  0   2   0 1.000 1.000 1.000
Marshall McConnell   5   4   4   3  0  1  0   1   0  .800  .833 1.200  fc
Truitt Cutre         6   9   4   3  1  0  0   4   1  .667  .818  .833  hbp sb
Jeremy Greene        6   2   4   1  1  0  0   0   0  .667  .667  .833  fc 2 sb 3
Gunnar Walker       34  12  18  15  4  1  0   8   4  .529  .619  .706  fc 2 sb 3
Frazier McNew        6   4   3   2  0  0  0   0   2  .500  .500  .500
Jordan Bryan         2   1   1   1  1  0  0   1   1  .500  .667 1.000
Travis Parma        13  12   5   1  0  0  0   4   3  .385  .556  .385  hbp sb fc roe sb 4
Brayden Welch       37  16  14  11  1  1  0   5   6  .378  .477  .459  hbp 2 sb roe 6 fc sb 10
Andrew Miller       27   4   9  10  1  2  0   5   7  .333  .514  .519  hbp 5 roe 3 sb 2
Brett Harwell        3   0   1   0  0  0  0   1   0  .333  .500  .333
Austin Bowers       19   8   6   9  1  2  0   7   5  .316  .483  .579  hbp sb 2
Bade Holland        19  11   6   9  0  1  0  11   3  .316  .563  .421  hbp sf fc 2 roe 2 sb 3
Zach Elson          23  10   7   7  1  1  0   9   3  .304  .515  .435  hbp fc 3 roe 4 sb
Reagan Ackerman     10   4   3   4  1  0  0   1   1  .300  .364  .400  roe 3 fc
Quinton Pearn        4   2   1   1  0  0  0   2   3  .250  .500  .250
Thomas Dorman       17   6   4   1  1  0  0   1   2  .235  .316  .294  hbp roe 4 sb 3
Hunter Anderson     11   2   2   5  0  0  0   4   4  .182  .400  .182  roe 2 sb 2
Cody Jones          29   1   5   4  0  0  0   4   9  .172  .265  .172  roe fc
Gibby Martinez       6   3   1   1  0  0  0   3   1  .167  .400  .167  roe sb
Brandon Monk        12   6   2   5  0  0  0  11   6  .167  .565  .167  fc sb
Chase Anderson       6   0   1   0  0  0  0   1   1  .167  .286  .167  roe fc sb
Hayden Baker        10   1   1   0  0  0  0   3   1  .100  .182  .100  roe 3
Adrian Duque         1   1   0   0  0  0  0   0   0  .000  .000  .000
AJ Acosta            3   7   0   1  0  0  0   3   2  .000  .500  .000  sb
Baylor Vickers       1   0   0   0  0  0  0   0   0  .000  .000  .000
Blayne Carnes        5   1   0   1  0  0  0   2   4  .000  .286  .000
Dane Sweet           1   1   0   0  0  0  0   2   0  .000  .667  .000  roe
Kolton Ramey         1   1   0   0  0  0  0   1   0  .000  .667  .000  hbp
Kyle Herber          1   1   0   0  0  0  0   0   0  .000  .000  .000
Lucas LeMore         1   1   0   1  0  0  0   2   1  .000  .667  .000
Reid Simpson         5   5   0   1  0  0  0   2   3  .000  .286  .000
Totals             324 138 103  96 13  9  0 100  73  .316  .495  .414  hbp 14

Pitching            ip  h  r er  bb so   W  L  S   era
Hunter Anderson    9.2  4  1  0  6  21   2  0  0  0.00  hb  2
Baylor Vickers     2.0  0  0  0  2   4   1  0  0  0.00  hb  0
Brayden Welch      0.1  0  0  0  0   0   1  0  0  0.00  hb  0
Hayden Baker      14.0  7  5  2  9  29   2  0  0  1.00  hb  0
Bade Holland      17.0  4 10  6 19  25   3  1  1  2.47  hb  7
Cody Jones        17.1 14 15  7  6  20   2  2  0  2.83  hb  9
Austin Bowers     18.0 12 21 11 26  20   1  0  1  4.28  hb  6
Totals            78.1 41 52 26 69 109  12  3  2  2.33  hb 24