Facebook Instagram Twitter Contact Us

Archive for the ‘Stats’ Category

Volleyball: CL Finished their Season in Loss, 3-0 Season & All-Time Stats

Saturday, November 9th, 2019

CL Hawks Finish season in the Area Round after successful, 23-18 record.      (Thanks goes to Hayley Melone for photos)


Canyon Lake once again came up short after losing in their Area Round to Bellville after finishing this season with a respectable, 23-18 record.

(more…)

Football Mid-Season Defensive Top 5

Monday, September 30th, 2019

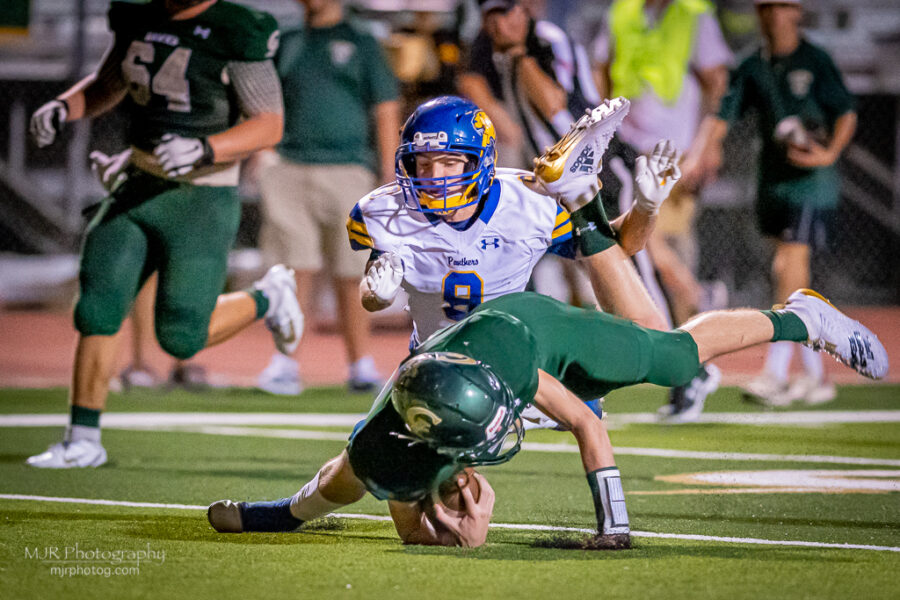
Canyon Lake High School Quarterback / Linebacker Brandon Robinson (#4) lunges over a defender for the Blanco running back.  rr[Photo Credit: Mark Robinson / MJR Photography / www.mjrphotog.com]

CL Hawks Top 5 Defensive Leaders

Canyon Lake is at their midseason stop and have compiled a 4-1 record going into District 28-4A next week.

(more…)

District 14-4A Standings & Stats (4 Games)

Monday, September 23rd, 2019

CLHS running back Derek Wiatrek (#2) rushes behind his blocker and scored a touchdown.  rr[Photo Credit: Mark Robinson / MJR Photography / www.mjrphotog.com]

                  Teams             W   L    Pct.    Pts    OPP
                  CL Hawks          3   1   .750      90     93
                  Lampasas          3   1   .750     207     93
                  Burnet            3   1   .750     153     87
                  Liberty Hill      2   2   .500     142    101
                  Fredericksburg    1   3   .250     113    136
                  Taylor            0   4   .000      28    150

                  Last Week’s Results
                  CL Hawks      55   Smithville   28
                  Lampasas      48   La Vernia    21
                  Liberty Hill  59   Connally     13
                  Burnet        52   Manor Tech   08
                  Salado        24   Taylor       21

                  This Week’s Games
                  Blanco        @    CL Hawks    7:30p
                  Burnet        @    Sonora
                  Boerne        @    Fredericksburg
                  Lampasas      @    Gatesville
                  La Grange     @    Taylor

            ++++++++++++++++++++++++++++++++++++++++++++++++++++++++

                      District 14-4A TEAM & INDIVIDUAL STATS

Teams           Pts Per Game           Teams          Pts Allowed Per Game
Lampasas           51.8                Burnet               21.8
Burnet             38.3                CL Hawks             23.3
Liberty Hill       35.6                Lampasas             23.3
Fredericksburg     28.3                Liberty Hill         25.3
CL Hawks           22.5                Fredericksburg       34.0
Taylor              7.0                Taylor               37.5

Offensive Rushing (per game)           Defensive Rushing (per game)
Liberty Hill      359.0                CL Hawks             69.5
CL Hawks          281.8                Lampasas            119.3
Lampasas          260.5                Liberty Hill        124.0
Fredericksburg    169.8                Fredericksburg      131.0
Burnet            125.6                Taylor              159.8
Taylor            118.8                Burnet              161.8

Offensive Passing                      Defensive Passing
Lampasas          322.3                Taylor               28.8
Fredericksburg    222.0                Burnet               60.5
Burnet            202.5                Liberty Hill        177.5
CL Hawks           58.5                Fredericksburg      200.8
Taylor             54.8                Lampasas            225.8
Liberty Hill       25.5                CL Hawks            232.8

Total Offense                          Total Defense
Lampasas          580.8                Taylor              184.5
Fredericksburg    393.8                Burnet              220.5
Liberty Hill      382.5                CL Hawks            302.3
CL Hawks          340.3                Liberty Hill        303.5
Burnet            330.0                Fredericksburg      330.8
Taylor            174.5                Lampasas            343.0

     ===================================================================

                       District Individual Leaders

            Passing           School  Comp  Att   Pct    Yds   Int  TD
            Ace Whitehead     Lamp     79   114  .693   1280    2   14
            Tucker Elliott    Billies  66   134  .493    854    5    9
            Mathew Tippie     Burnet   63   103  .612    818    0   13
            Peyton McMullen   CL Hawks 14    40  .350    235    2    3
            Michael Schneider Taylor   14    27  .519    198    1    2
            Jacob Cearley     L Hill    3     7  .429     39    0    1

            Rushing           School   Att  Yds   Ave   Lg   TD
            Blake Simpson     L Hill   72   535   7.4   78   4
            Trey Seward       L Hill   66   532   8.1   72   7
            Jack Jerome       Lamps    65   451   6.9   58   6
            James Bates       CL Hawks 22   304  13.8   80   2
            Derek Wiatrek     CL Hawks 59   286   4.8   30   4
            Tucker Elliott    Billies  66   273   4.1   59   2
            Daunte Cuffie     Lamps    26   245   9.4   20   2
            Nash Robinson     L Hill   43   219   5.1   40   4
            Marcus Escamilla  Burnet   50   198   3.9   26   2
            Ethan Slater      CL Hawks 32   168   5.3   18   1

            Receiving         School   Att  Yds   Ave   Lg   TD
            Jarrett Beard     Billies  24   479  19.9   51   8
            Cameron Everts    Lamps    33   437  13.2   63   3
            Michael Murray    Lamps    17   386  22.7   82   5
            Jaylon Porter     Lamps    21   356  16.9   34   4
            Blaine Burkhalter Burnet   16   275  17.2   60   3
            Bradyn McPherson  Burnet   10   154  15.4   51   4
            Joshua Wienecke   Billies   9   112  12.4   30   0
            Jeremy Greene     CL Hawks  5   105  21.0   42   1
            Marcus Escamilla  Burnet   13   105   8.1   26   1
            Kyle Yuill        CL Hawks  4    58  14.5   30   1

(Stats were compiled from The ReSporter, Max-Preps and Maury Salinger)

Football Season Stats for All 4 Hawk Teams

Thursday, September 12th, 2019

Canyon Lake High School Quarterback Peyton McMullen (#12) rushes for a few yards on a keeper against Pflugerville Weiss High School.rr[Photo Credit: Mark Robinson / MJR Photography / www.mjrphotog.com]

Canyon Lake will be going into their 3rd week of action this week and The ReSporter has a computation of these past two games.

(more…)

Football: CL Hawks Individual Offensive Records

Tuesday, August 27th, 2019

Running back Nic Rivera (#15) rushes for a touchdown. [Photo Credit: Mark Robinson / MJR Photography / www.mjrphotog.com]


      Top 10 Scorers                         Top 10 Rushers/Receiving Combined
      Zach Henshaw          306              Zach Henshaw           4833
      Tanner Faris          248              Tanner Faris           3799
      Trenton Lorett        213              Josh DeVries           2561
      Tristan Chacon        194              Tristan Chacon         2376
      Josh DeVries          182              Austin Brennan         1989
      Hayden Dubose         156              Hayden Dubose          1947
      Austin Brennan        150              Eduardo Covarrubias    1832
      Micah St. John        146              Micah St. John         1648
      Mike Thorpe           124              Jacob Ruff             1448
      Eric Nelson           108              McGuire Johnson        1358

      Top Passers                            Receiving Yards
      Ross Wagliardo       3896              Eric Nelson            1527
      Branson Belcher      3101              Matt Magness           1041
      Ben Fulton           2165              Tanner Faris            741
      Jeffrey Nabors       1709              Drew Riccio             687
      Skyler Tschoepe      1076              Doug Hubnik             645
      Peyton McMullen       738              Daniel Camarillo        617
                                             Richard Howell          533
                                             Jeremy Fulton           515
                                             Zach Henshaw            509
                                             Austin Brennan          476

      Touchdowns Thrown                      Passes Thrown
      Brandon Belcher        28              Ross Wagliardo          559
      Ben Fulton             26              Branson Belcher         339
      Ross Wagliardo         25              Jeffrey Nabors          272
      Jeffrey Nabors         16              Ben Fulton              209
      Skyler Tschoepe         8              Skyler Tschoepe         123
      Peyton McMullen         4              Peyton McMullen          69

      Points After Touchdown                 Field Goals
      Trenton Lorett        130              Trenton Lorett            9
      Mike Thorpe            97              Mike Thorpe               9
      Jake Robinson          79              Jake Robinson             5
      Jacob Crabb            34              Juan Martinez             4
      Juan Martinez          29
      Lester Boehm            3
      James Richardson        2
      Jacob Neel              2
      Trent Tucker            2
      Nash Young              1

      Career Rushing                         Rushing for Season
      Zach Henshaw         4324              Zach Henshaw           2070   2011
      Tanner Faris         2278              Josh DeVries           1389   2014
      Josh DeVries         2104              McGuire Johnson        1306   2013
      Hayden Dubose        1963              Tanner Faris           1206   2016
      Micah St. John       1648              Zach Henshaw           1161   2010
      Eduardo Covarrubias  1607              Tristan Chacon         1071   2017
      Austin Brennan       1513              Zach Henshaw           1093   2009
      Jacob Ruff           1391              Austin Brennan         1006   2016
      McGuire Johnson      1332              Hayden Dubose           956   2014
      Robert Woods          906              Tanner Faris            938   2015

      Longest Run or Reception Touchdowns
      Chance Martelli        93          Receiving     2018    Wimberley
      Austin Brennan         90          Rushing       2016    Blanco
      Matt Magness           88          Receiving     2010    Luling
      Trenton Lorett         87          Rushing       2017    Austin Reagan
      Matt Magness           84          Receiving     2010    Fredericksburg
      Josh DeVries           82          Rushing       2014    Smithville
      Jacob Ruff             79          Rushing       2018    Burnet
      Zach Henshaw           79          Receiving     2011    Luling
      Eric Nelson            77          Receiving     2009    Liberty Hill
      Tanner Faris           76          Rushing       2015    Bandera

Football: Offensive All-Time Team Stats

Monday, August 26th, 2019

Canyon Lake High School Strong Safety Trenton Lorett (#21) intercepts Blanco’s pass.  (photo by MJR.photog.com)


Points Best Average Year Games                 Offensive Plays for Year
     38.0     2016     11                           746     2017
     35.3     2013     10                           688     2010
     34.9     2017     13                           674     2014
     30.4     2014     12                           650     2013
     26.8     2018     11                           634     2009
     23.4     2010     12                           584     2015
     22.5     2015     11                           573     2016
     21.6     2012     10                           547     2018
     19.6     2009     11                           537     2011
     19.0     2013     12                           523     2012
      7.2     2008     10

      Rushing Plays                                 Passing Plays
      654     2017                                  318     2009
      603     2014                                  277     2010
      583     2013                                  177     2012
      510     2015                                  159     2011
      510     2016                                   92     2017
      478     2018                                   74     2015
      422     2010                                   71     2014
      378     2011                                   69     2018
      346     2012                                   67     2013
      311     2009                                   63     2016

      Rushing Yards                                 Passing Yards
     4264     2017                                 2436     2009
     3403     2016                                 1930     2010
     3269     2014                                 1613     2011
     3206     2013                                 1501     2012
     3016     2018                                 1020     2017
     2773     2015                                  829     2016
     2447     2011                                  746     2018
     2062     2010                                  721     2014
     1580     2012                                  467     2015
     1174     2009                                  440     2013

     Total Yards                               Total Yards Per Game Ave.
     5284     2017                                416.4     2016
     4580     2016                                406.5     2017
     4060     2011                                406.0     2011
     3992     2010                                346.4     2018
     3990     2014                                332.7     2010
     3811     2018                                332.5     2014
     3646     2013                                328.2     2009
     3610     2009                                308.1     2013
     3260     2015                                303.8     2012
     3081     2012                                296.4     2015

                         Total First Downs
                         269      2017
                         202      2016
                         195      2014
                         192      2011
                         188      2018
                         175      2010
                         170      2015
                         165      2009
                         158      2013
                         139      2012

CL Hawks All-Time Rushing Stats

Friday, June 21st, 2019

                                Last Hawk game against Needville in Bi-District Round.           (Photo by Karen Holmes)


With Football Season within striking distance, The ReSporter wanted to give some rushing stats.

This will be the 10th year for The ReSporter and the Hawks will be starting their 11th campaign. That first year of stats are not recorded so the rushing numbers are based on 10 seasons.

Hope this helps during these dog days of Summer.

Go Hawks!!


    Top Season Yardage                        Career Rushing Yardage
 1) Zach Henshaw         2062   2011       1) Zach Henshaw          4363
 2) Josh DeVries         1389   2014       2) Tanner Faris          3058
 3) McGuire Johnson      1306   2013       3) Josh DeVries          2104
 4) Zach Henshaw         1161   2010       4) Micah St. John        2020
 5) Tanner Faris         1106   2016       5) Hayden Dubois         1963
 6) Zach Henshaw.        1141   2009       6) Tristan Chacon        1934
 7) Tristan Chacon       1071   2017       7) Eduardo Covarrubias   1711
 8) Austin Brennan       1006   2016       8) Jacob Ruff            1702
 9) Hayden Dubois         956   2014       9) Austin Brennan        1513
10) Tanner Faris          938   2015      10) McGuire Johnson       1337
11) Tanner Faris          914   2017      11) Robert Woods           946
12) Jacob Ruff            904   2018      12) Caleb Almond           662
13) Micah St. John        878   2016      13) Joseph Ruiz            637
14) Tristan Chacon        833   2018      14) Trenton Lorett         539
15) Eduardo Covarrubias   789   2010      15) Ben Fulton             430
16) Micah St. John        773   2016      16) Casey Coffee           404
17) Josh DeVries          715   2013
18) Micah St. John        643   2017          Still Active
19) Joseph Ruiz           495   2017          Nic Rivera             231
20) Jacob Ruff            434   2017

                ++++++++++++++++++++++++++++++++++++++++++++++++++++++++++++++++++

    Rushing Attempts Season                   Rushing Attempts Career
 1) Zach Henshaw          277   2011       1) Zach Henshaw           724
 2) Zach Henshaw          253   2009       2) Hayden Dubois          421
 3) McGuire Johnson       206   2013       3) Micah St. John         377
 4) Zach Henshaw          194   2010       4) Tanner Faris           364
 4) Hayden Dubois         194   2014       5) Tristan Chacon         310
 6) Josh DeVries          178   2014       6) Eduardo Covarrubias    295
 7) Hayden Dubois         162   2013       7) Josh DeVries           293
 8) Micah St. John        153   2016       8) Jacob Ruff             266
 9) Tristan Chacon        152   2018       9) McGuire Johnson        212
10) Tristan Chacon        151   2017      10) Austin Brennan         194
11) Robert Woods          141   2014      11) Robert Woods           192
12) Eduardo Covarrubias   138   2012      12) Ben Fulton             139
13) Tanner Faris          132   2015      13) Branson Belcher        107
14) Tanner Faris          131   2016      14) Joseph Ruiz             83
15) Eduardo Covarrubias   128   2010      15) Skyler Tschoepe         81
16) Micah St. John        125   2017
17) Josh DeVries          115   2013
18) Austin Brennan        108   2016
19) Jacob Ruff            104   2018
20) Tanner Faris          101   2017

              ++++++++++++++++++++++++++++++++++++++++++++++++++++++++++++++++++

    Rushing Average All-Time                  Top Game               Yds  Opponent   Year
 1) Trenton Lorett        8.6   2018       1) Zach Henshaw           300  Billies    ’11
 2) Tanner Faris          8.4   2017       2) Zach Henshaw           297  Sealy      ’11
 3) Austin Brennan        7.8   2016       3) Zach Henshaw           287  Navarro    ’11
 4) Joseph Ruiz           7.7   2017       4) Zach Henshaw           266  Somerset   ’10
 5) Josh DeVries          7.2   2015       5) Zach Henshaw           252  Travis     ’11
 6) Caleb Almond          7.1   2018       6) Zach Henshaw           243  Burnet     ’10
 7) Jacob Ruff            6.4   2018       7) Zach Henshaw           233  Bandera    ’11
 8) McGuire Johnson       6.3   2013       8) Jacob Ruff             222  Smithville ’18
 9) Tristan Chacon        6.2   2018       9) Josh DeVries           213  Rockport   ’14
10) Zach Henshaw          6.0   2011      10) Austin Brennan         211  Billies    ’16
11) Eduardo Covarrubias   5.8   2012      11) Zach Henshaw           209  Gonzales   ’09
12) Casey Coffee          5.2   2013      12) Tanner Faris           205  Boerne     ’16
13) Micah St. John        5.1   2017      13) Zach Henshaw           200  Blanco     ’13
14) Robert Woods          4.9   2016      14) McGuire Johnson        199  Somerset   ’13
15) Hayden Dubois         4.7   2014

         ++++++++++++++++++++++++++++++++++++++++++++++++++++++++++++++++++++

    Top 10 Touchdowns Season                  Top Rushing Touchdowns Career
 1) Zach Henshaw           25   2011       1) Zach Henshaw            47
 2) Josh DeVries           17   2014       2) Tanner Faris            32
 3) Hayden Dubois          16   2014       3) Tristan Chacon          28
 4) Micah St. John         14   2016       4) Hayden Dubois           26
 5) Jacob Ruff             13   2018       5) Micah St. John          24
 6) Austin Brennan         12   2016       6) Josh DeVries            23
 7) Zach Henshaw           11   2009       7) Austin Brennan          20
 7) Zach Henshaw           11   2010       8) Jacob Ruff              16
 9) Tanner Faris           10   2016       9) Branson Belcher         13
10) Austin Brennan          9   2015      10) Eduardo Covarrubias     11
10) Tristan Chacon          9   2018      10) McGuire Johnson         11

          ++++++++++++++++++++++++++++++++++++++++++++++++++++++++++++++++++++++

    Total Touchdowns (receiving, etc)         Rushing Ave for a Game        Yds  Att
 1) Zach Henshaw           51              1) Austin Brennan        21.3    170    8
 2) Tanner Faris           41              2) Trenton Lorett        19.8    158    8
 3) Tristan Chacon         32              3) Austin Brennan        17.6    211   12
 4) Josh DeVries           29              4) Nic Rivera            14.7     88    6
 5) Hayden Dubois          26              5) Tanner Faris          14.1    155   11
 6) Austin Brennan         25              6) Caleb Almond          13.8    124    9
 7) Micah St. John         24              7) Josh DeVries          13.3    213   16
 8) Eric Nelson            18              8) Tanner Faris          13.0    143   11
 9) Jacob Ruff             17              9) Austin Brennan        12.9    103    8
10) Matt Magness           16             10) Tanner Faris          12.8    205   16
11) Branson Belcher        13
12) Eduardo Covarrubias    11
12) McGuire Johnson        11
14) Doug Hubnik            10

MV Hawks have SVMS next, Standings & Season Stats

Tuesday, May 21st, 2019

      Helijah Johnson is one of many Hawks contributing on offense.         (photo by RC McConnell)


             Team               W  L  T    GB   RS   RA
             Mountain Valley    3  0  0    -—   33    8
             Spring Branch      3  1  0   0.5   22   15
             Smithson Valley    2  1  0   1.0   15   14
             Danville           2  2  0   1.5   29   21
             SA Christian       1  1  1   2.0   12   11
             Church Hill        1  3  0   2.5   22   24
             Pieper Ranch       1  3  0   2.5   15   31
             Canyon             0  2  1   3.0    8   23

             May 23rd Games
             Mountain Valley   vs.   SVMS @ SVHS
             PRMS              vs.   SBMS
             SA Christian      vs.   DMS
             CHMS              vs.   CMS
    +++++++++++++++++++++++++======================++++++++++++++++++

(more…)

CL Hawks Team Statistics

Thursday, May 9th, 2019

Cale Claycomb was one of several Hawk pitchers to have lowest era. [Photo Credit: Mark Robinson / MJR Photography / www.mjrphotog.com]

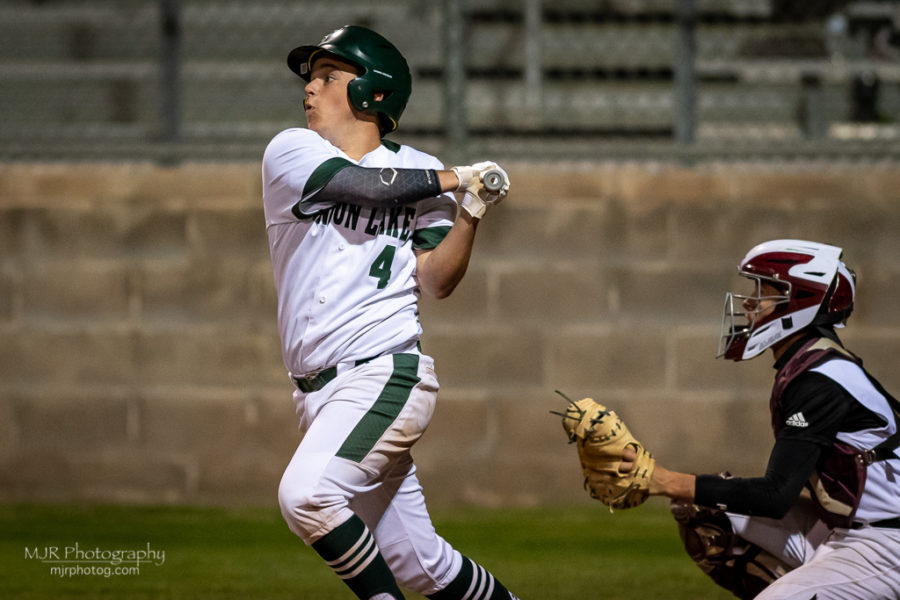
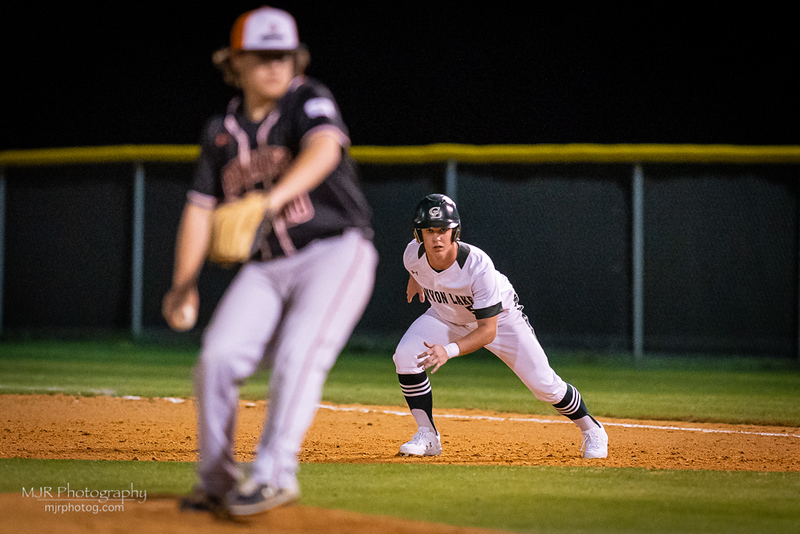
Canyon Lake Baseball has started an upward swing in these past two seasons and The ReSporter has some team statistics that will help in giving you an idea of where these past two years compared to previous campaigns.

(more…)

Boy’s & Girl’s Soccer Playoffs in Burnet

Wednesday, March 27th, 2019

                                                                   Trenton Lorett & Hawks Take Down Freddie, 5-1.
(photo by Lynne Carpenter)

Canyon Lake will have a double-header on Thursday when the Lady Hawks kick-off the action at 5:30pm and then will have the Boys waiting on deck.

(more…)