CL Hawks Team Statistics

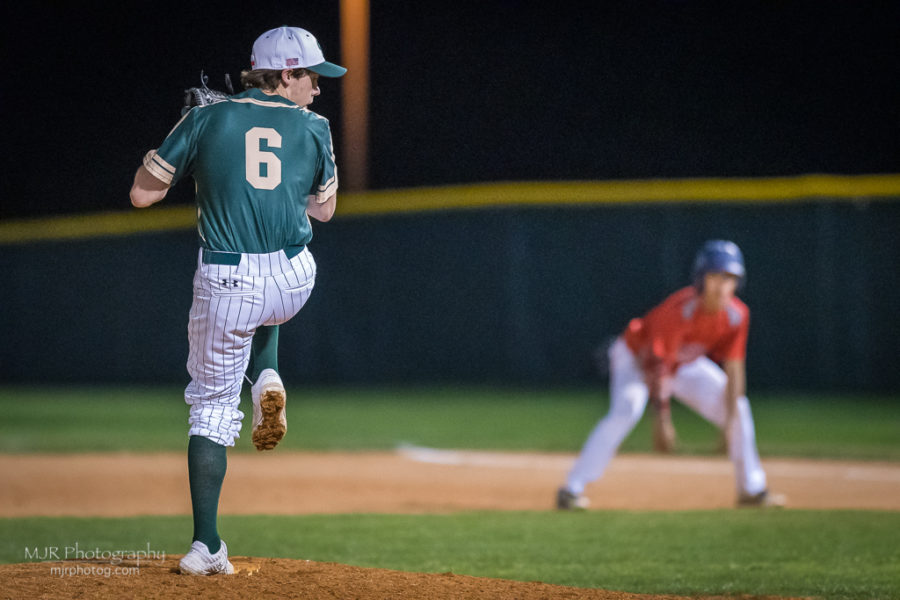
Cale Claycomb was one of several Hawk pitchers to have lowest era. [Photo Credit: Mark Robinson / MJR Photography / www.mjrphotog.com]
Canyon Lake Baseball has started an upward swing in these past two seasons and The ReSporter has some team statistics that will help in giving you an idea of where these past two years compared to previous campaigns.

Way to Go Hawks!
These numbers would changed based on the number of games played each year, but as an overall picture this would give a good indication of how the future might result in having a better end results.
This season had several Freshman taking on a huge amount of innings and add some key Sophomores that stepped up will give you an idea of what another year of growth might play into some of those district games coming in the form of wins.
Canyon Lake has had just one year where they finished with an above average in district contests. That season was in 2010 which happened to be the first playoff season. That year the Hawk’s Baseball team was the first sport to win a Bi-District round. In fact, the team came within one run of going to the next round.
Freshman that are facing a Senior will in most cases always benefit that older player and with Canyon Lake using just one Senior (Tanner Sellers) that certainly played in those travails this past campaign. Now another year would have a chance of changing a team with a chance of better results.
Think, for a moment, of being a Freshman or Sophomore next year and how hard it might be to squeeze into this roster much less finding a starting spot. That will instill these players with a chance to increase their skill set during this off season in order to turn heads when school starts in August.
Mountain Valley has a solid group of 8th Graders in the pipeline and there will not be a lot of openings unless a player would give the Coaches no choice but to let them find a spot in the line-up based on how much they are playing.

Way to plug Leaks Hawks!
This type of competition will have a trickle up effect since those older players will be working extra hard to keep a spot on Varsity as well…..as you can see, this is good news for CL’s baseball program.
On the Team Stats below, there are 4 years missing from 2012-2015 with the loss of those stats last year. But, those good early years are available on these lists.
Fielding is an important stat giving you a good idea of how well the defense played. Canyon Lake had their best defensive season, by a wide margin, and that is a good omen. These last two years both Hawk teams have hit the .900 plateau which helps in many ways for a baseball program in getting out of innings with minimal damage in runs scored and the pitch count for those pitchers.
Hope you enjoy these stats and The ReSporter has heard there are two teams forming for the Summer with the 14 and Under and 16 and Under teams.
Keith Doerfler and Rich Anderson are the two dads that are spearheading those two teams if interested.
Go Hawks!!
          Batting Average        On Base Average        Slugging Percentage
         .283     2009          .394     2009          .397     2009
         .269     2019          .386     2019          .350     2019
         .252     2011          .385     2011          .320     2011
         .238     2010          .367     2018          .316     2010
         .215     2018          .352     2010          .267     2016
         .211     2016          .327     2016          .257     2018
         .163     2017          .283     2017          .188     2017

          At Bats                Runs Scored            Hits
          680     2010           122     2009           163     2019
          605     2019           116     2010           151     2009
          599     2018           114     2019           134     2010
          534     2009           100     2018           129     2018
          527     2017            99     2011           127     2011
          503     2011            53     2016           105     2016
          498     2016            50     2017            86     2017

          Runs Batted In         Extra Base Hits        Base on Balls
           92     2009            44     2009           104     2018
           92     2019            33     2010            93     2011
           79     2010            30     2019            90     2019
           77     2018            30     2011            85     2009
           77     2011            24     2018            83     2010
           51     2016            24     2016            75     2016
           31     2017            12     2017            64     2017

          Strikeouts             Fielding               Runs Allowed
          138     2009          .928     2019           123     2010
          141     2011          .904     2018           133     2019
          145     2010          .900     2011           142     2011
          164     2016          .871     2016           170     2009
          167     2019          .863     2010           186     2017
          169     2017          .861     2017           210     2016
          174     2018          .860     2009           223     2018

          Hits Allowed           Base on Balls Allowed  Strikeouts
          130     2010            66     2011           201     2019
          167     2009            67     2019           133     2009
          176     2011            76     2009           126     2010
          186     2017            80     2010           123     2018
          202     2019            89     2016           101     2017
          204     2016            91     2017            98     2011
          223     2018           104     2018            89     2016

                                 Earned Run Average
                                 3.75    2019
                                 4.27    2010
                                 5.38    2017
                                 5.41    2018
                                 5.69    2011
                                 6.43    2016
                                 6.47    2009


