Facebook Instagram Twitter Contact Us

Football, Stats | August 26, 2019

Football: Offensive All-Time Team Stats
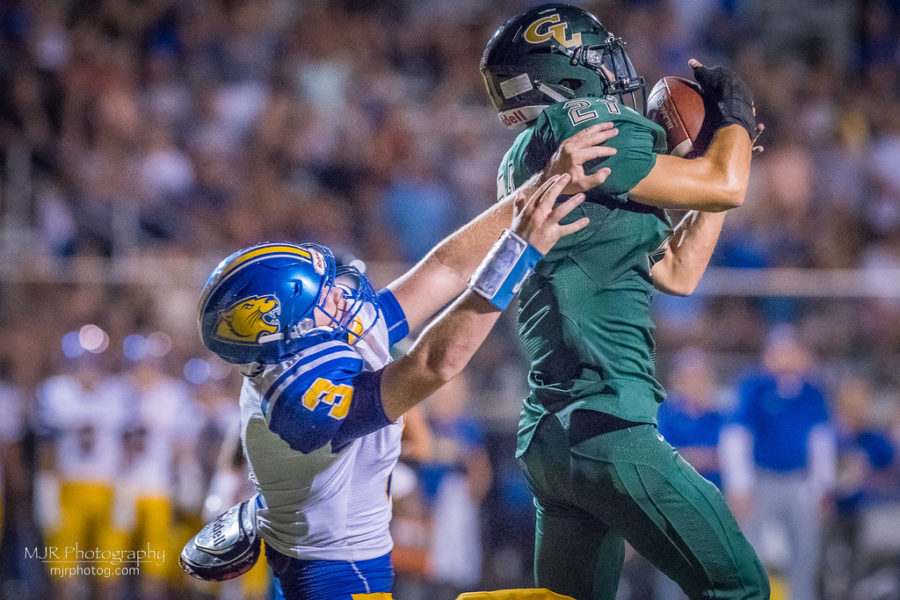
Canyon Lake High School Strong Safety Trenton Lorett (#21) intercepts Blanco’s pass.  (photo by MJR.photog.com)


Points Best Average Year Games                 Offensive Plays for Year
     38.0     2016     11                           746     2017
     35.3     2013     10                           688     2010
     34.9     2017     13                           674     2014
     30.4     2014     12                           650     2013
     26.8     2018     11                           634     2009
     23.4     2010     12                           584     2015
     22.5     2015     11                           573     2016
     21.6     2012     10                           547     2018
     19.6     2009     11                           537     2011
     19.0     2013     12                           523     2012
      7.2     2008     10

      Rushing Plays                                 Passing Plays
      654     2017                                  318     2009
      603     2014                                  277     2010
      583     2013                                  177     2012
      510     2015                                  159     2011
      510     2016                                   92     2017
      478     2018                                   74     2015
      422     2010                                   71     2014
      378     2011                                   69     2018
      346     2012                                   67     2013
      311     2009                                   63     2016

      Rushing Yards                                 Passing Yards
     4264     2017                                 2436     2009
     3403     2016                                 1930     2010
     3269     2014                                 1613     2011
     3206     2013                                 1501     2012
     3016     2018                                 1020     2017
     2773     2015                                  829     2016
     2447     2011                                  746     2018
     2062     2010                                  721     2014
     1580     2012                                  467     2015
     1174     2009                                  440     2013

     Total Yards                               Total Yards Per Game Ave.
     5284     2017                                416.4     2016
     4580     2016                                406.5     2017
     4060     2011                                406.0     2011
     3992     2010                                346.4     2018
     3990     2014                                332.7     2010
     3811     2018                                332.5     2014
     3646     2013                                328.2     2009
     3610     2009                                308.1     2013
     3260     2015                                303.8     2012
     3081     2012                                296.4     2015

                         Total First Downs
                         269      2017
                         202      2016
                         195      2014
                         192      2011
                         188      2018
                         175      2010
                         170      2015
                         165      2009
                         158      2013
                         139      2012