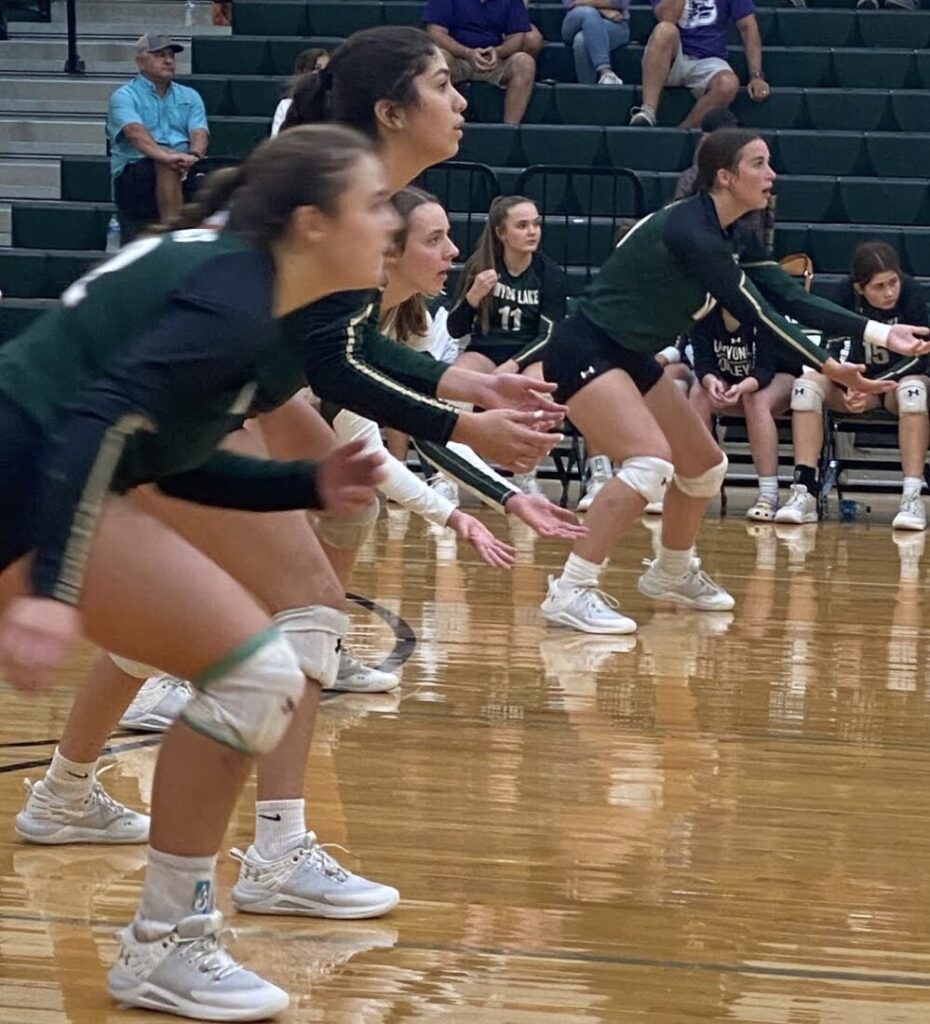
The ReSporter had a chance to catch-up with Head Volleyball Coach Daniella Villarreal after her first year at the helm and she shared her thoughts on this season as well as the future.

The ReSporter had a chance to catch-up with Head Volleyball Coach Daniella Villarreal after her first year at the helm and she shared her thoughts on this season as well as the future.
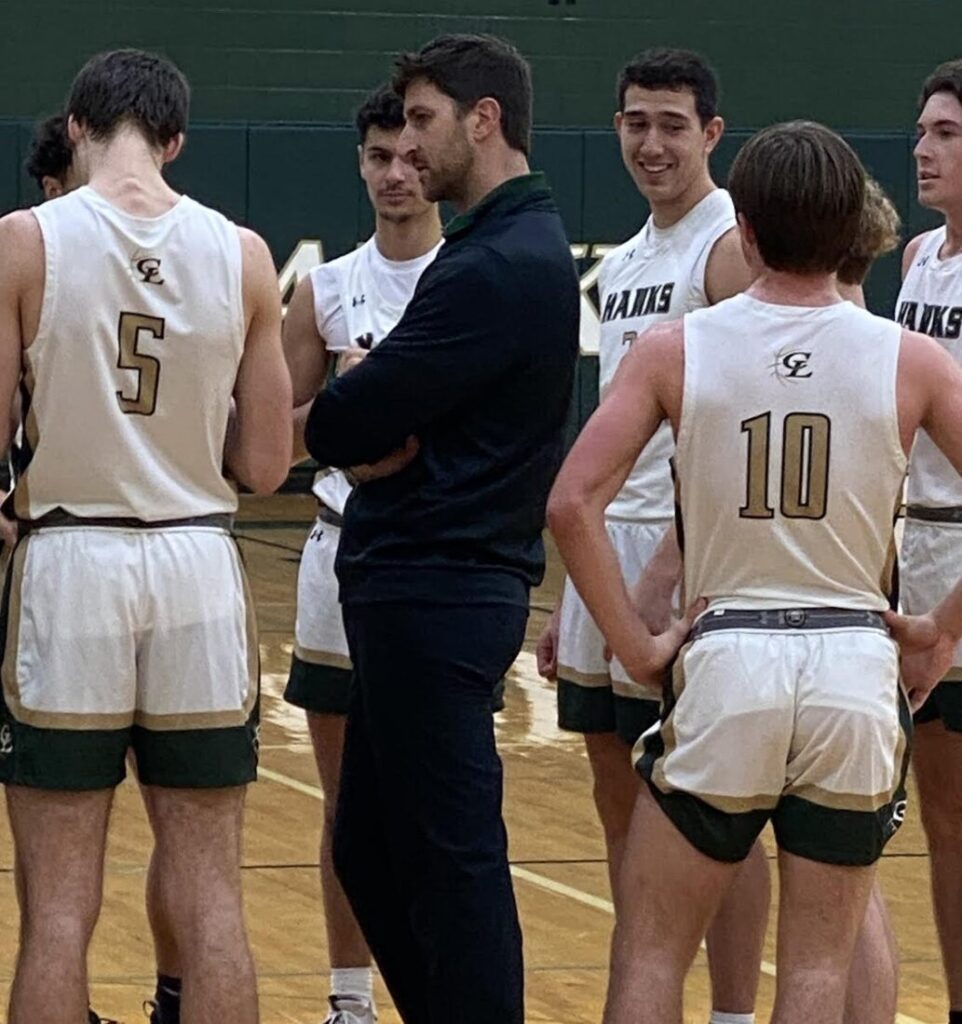
Future Hawks wanting to make a future Top 10 Lists. Go Hawks!!
A shout out to all those Alumni Basketball Players that frequent this site (at least once a year) to see where they stand on these All-Time scenarios.
Hey Andrew Riali….The Hawk Nation hopes all the Alumni are doing well & way to Go Hawks!!
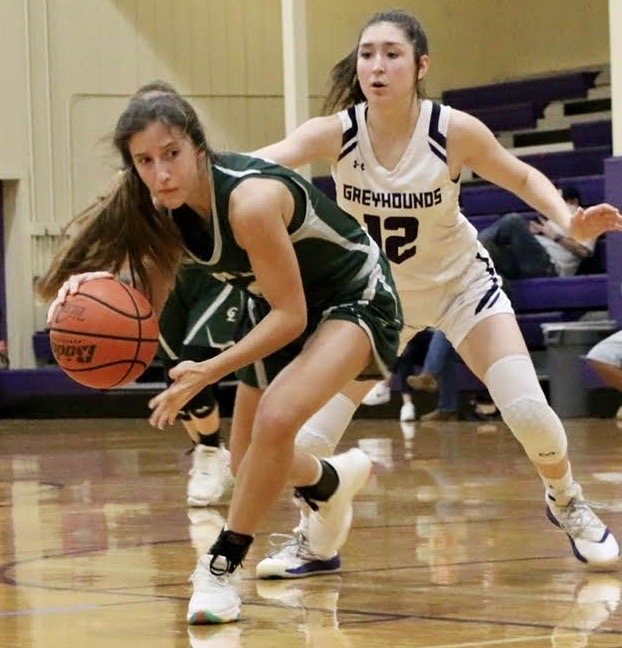
Sofia George will look to finish higher in those Top 10 metrics after opening this season scoring 35 points. Go Hawks!!
                  LADY BASKETBALL TOP 10

ALL-TIME               POINTS  SEASON                   YEAR
Reagan Heun       1348         Reagan Heun        567   2018
Chelsea Tschoepe   862         Ashley Pfaff       494   2010
Alexa Ramos        767         Reagan Heun        455   2017
Katie Williams     755         Tiffany Tschoepe   342   2011
Sofia George       741         Sofia George       337   2022
Jessie Melendez    590         Katie Williams     326   2013
Marley Carrizales  587         Reagan Heun        326   2015
Tiffany Tschoepe   515         Reece Coburn       309   2023
Lainee Moses       504         Sofia George       301   2023
Ashley Pfaff       494         Marley Carrrizales 298   2020

                    FIELDS GOALS
Reagan Heun        388         Reagan Heun        161   2018
Katie Williams     315         Ashley Pfaff       151   2010
Chelsea Tschoepe   298         Katie Williams     140   2013
Alexa Ramos        283         Tiffany Tschoepe   135   2011
Sofia George       264         Reagan Heun        127   2017
Jessie Melendez    235         Jessica McMurray   114   2010
Marley Carrizales  213         Reagan Heun        113   2015
Amber Ramsey       190         Sofia George       112   2022
Tiffany Tschoepe   188         Sofia George       112   2023
Lainee Moses       174         Marley Carrizales  105   2020

                       BLOCKS
Caroline Kullberg  141         Caroline Kullberg   71   2019
Amber Ramsey       129         Caroline Kullberg   63   2018
Jessie Melendez     78         Amber Ramsey        48   2013
Katie Williams      73         Amber Ramsey        46   2012
Sarah Schneider     71         Alexis Fuller       39   2015
Mya Vornis          56         Tiffany Tschoepe    38   2011
Tiffany Tschoepe    48         Sarah Schneider     34   2016
Alexis Fullen       40         Katie Williams      33   2012
Reagan Heun         39         Emma Gray           32   2016
Sofia George        37         Mya Vorhis          31   2023
                               Jessie Melendez     31   2019

                       ASSISTS
Lainee Moses       233         Lainee Moses        96   2020
Marley Carrizales  189         Lainee Moses        95   2019
Chelsea Tschoepe   158         Tiffany Arredondo   92   2010
Alexa Ramos        152         Ashley Pfaff        89   2010
Reagan Heun        145         Marley Carrizales   78   2019
Tiffany Arredondo  125         Marley Carrizales   75   2019
Reece Coburn        93         Reagan Heun         71   2018
Ashley Pfaff        89         Chelsea Tschoepe    60   2020
Jessie Melendez     89         Jessica McMurray    59   2010
Megan Browning      83         Alexa Ramos         54   2018
                               Reece Coburn        54   2023

                       STEALS
Alexa Ramos        301         Marley Carrizales  106   2019
Marley Carrizlaes  261         Ashley Pfaff        96   2010
Lainee Moses       258         Chelsea Tschoepe    95   2019
Chelsea Tschoepe   249         Amber Ramsey        94   2012
Amber Ramsey       201         Marley Carrizales   93   2020
Reagan Heun        171         Alexa Ramos         90   2018
Sofia George       165         Lainee Moses        87   2020
Miia Riali         148         Lainee Moses        84   2019
Katie Williams     139         Alexa Ramos         81   2017
Mya Vorhis         128         Sofia George        79   2022

                     FREE THROWS
Reagan Heun        404         Reagan Heun        196   2018
Alexa Ramos        185         Ashley Pfaff       153   2010
Chelsea Tschoepe   155         Reagan Heun        145   2017
Ashley Pfaff       152         Megan Browning      85   2011
Tiffany Tschoepe   139         Reece Coburn        83   2023
Megan Browning     133         Tiffany Arredondo   79   2010
Katie Williams     119         Tiffany Tschoepe    72   2011
Sofia George       118         Sofia George        68   2022
Marley Carrizales  115         Marley Carrizales   67   2020
Reece Coburn       103         Tiffany Tschoepe    67   2010

                    3 POINT MAKES
Reagan Heun        136         Sophia Barber       65   2020
Chelsea Tschoepe   130         Reagan Heun         56   2017
Sophia Barber      102         Chelsea Tschoepe    46   2019
Sofia George        95         Reagan Heun         45   2018
Sarah Russell       62         Sofia George        43   2022
Reece Coburn        43         Chelsea Tschoepe    42   2020
Olivia Flores       42         Sofia George        41   2023
Marley Carrizales   41         Ashley Pfaff        39   2010
Ashley Pfaff        39         Sophia Barber       36   2019
Char Hutson         30         Olivia Flores       36   2012
Kaitlyn Cox         30         Reagan Heun         35   2015

                       REBOUNDS
Jessie Melendez    848         Tiffany Tschoepe   297   2011
Chelsea Tschoepe   616         Tiffany Tschoepe   282   2010
Tiffany Tschoepe   579         Jessie Melendez    275   2019
Katie Williams     559         Amber Ramsey       254   2012
Amber Ramsey       558         Reagan Heun        253   2018
Reagan Heun        544         Amber Ramsey       241   2013
Caroline Kullberg  381         Katie Williams     225   2012
Kyndall Drum       377         Katie Williams     216   2013
Mya Vorhis         368         Jessie Melendez    216   2020
Kaitlyn Cox        312         Jessie Melendez    213   2018
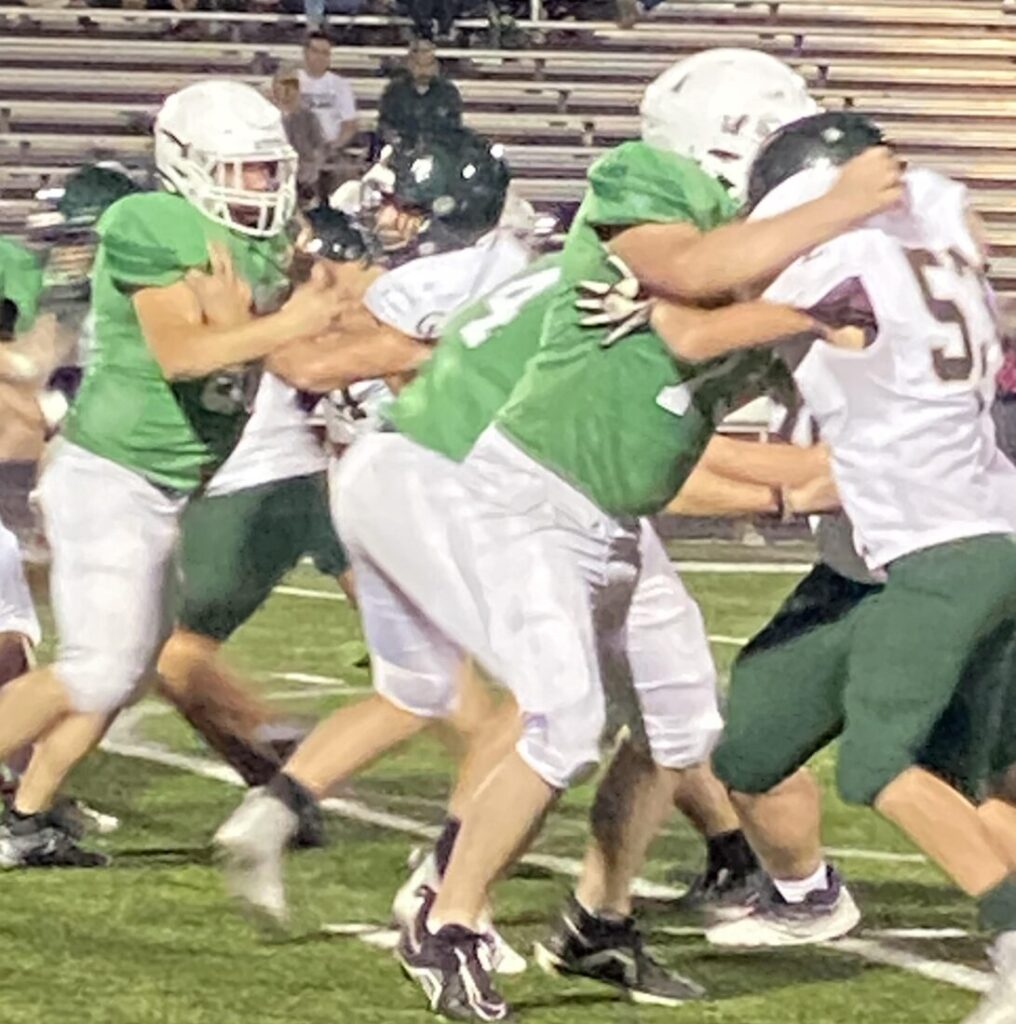
Holding on in Hawk JV game with Burnet.
Canyon Lake was on the losing end for their two sub-varsity outings at Burnet on Thursday.
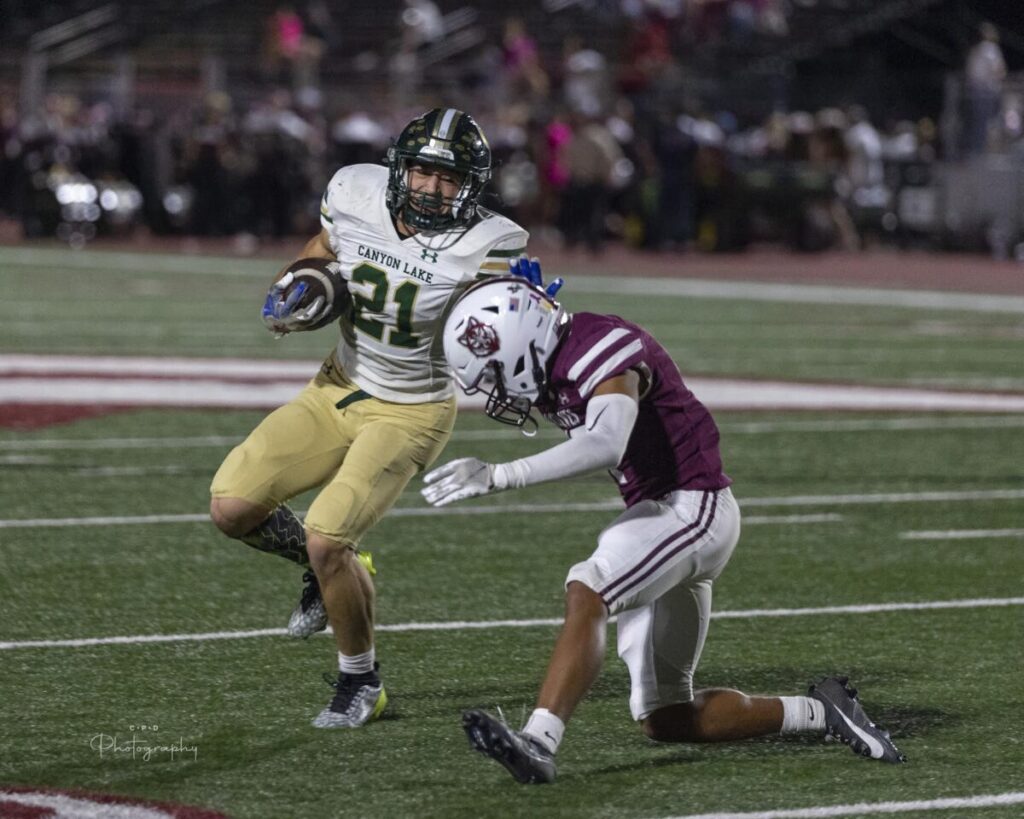
Trevin Cutrer trying to set the edge for a long gain in loss to Davenport.
(photo by Chris Doepke)
Canyon Lake Recaps past week of sports.
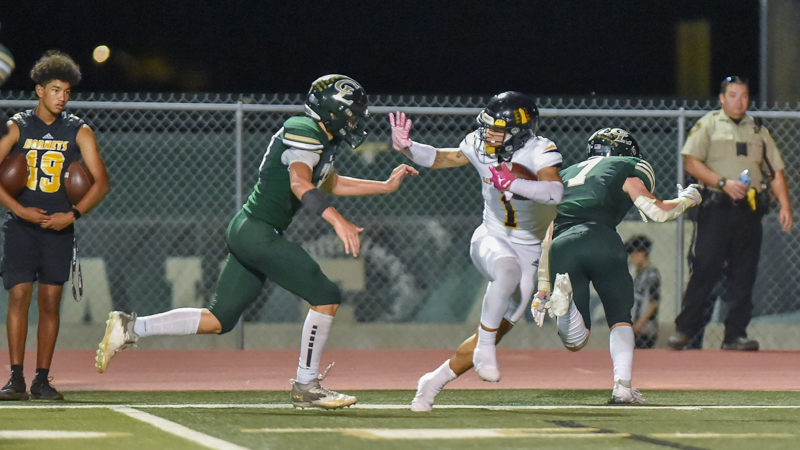
(photo by Dan Reed Photography https://www.danreedphotography.com)
The real deal started last Friday and there are several teams with a legit shot of finishing on top and that blur will become clearer after this week of games.

A Gang sighting in Canyon Lake had Billies calling 9-1-1. Way to Go Hawks!!
(photo by Dan Reed Photography https://www.danreedphotography.com)
    RECORDS By The NUMBERS!

  2 All-Time Punts returned for Touchdown. (Coach McDonough 1)
  4 Plays the 2023 Offense has reached 70 or more in yards.
  7 Different Times Trenton Lorett has scored.
    Rushing-Receiving-Interception-Kick Off-2pt-pat-field goal.
 10 District games won over .500.
 11 Games won over .500 at Home.
 15 Hawks that have scored 100 or more points.
 20 Times CL has had a runner reach 200 yds. (Carter Williams 200)
 27th Place that Harris Gilliam stands on All-Time Rec Yards.
 37 Consecutive games scored in since last shut-out.
 45 Most points given up in a Hawk win (Billies)
 52 Tenth most points scored. (Billies)
 54 Average points for CL Defense this year.
 97 Combined points scored which is 2nd most in a game. (Billies)
306 Zach Henshaw leads with points scored.
336 Passing Yards given up in Billie game, most in CL’s History.
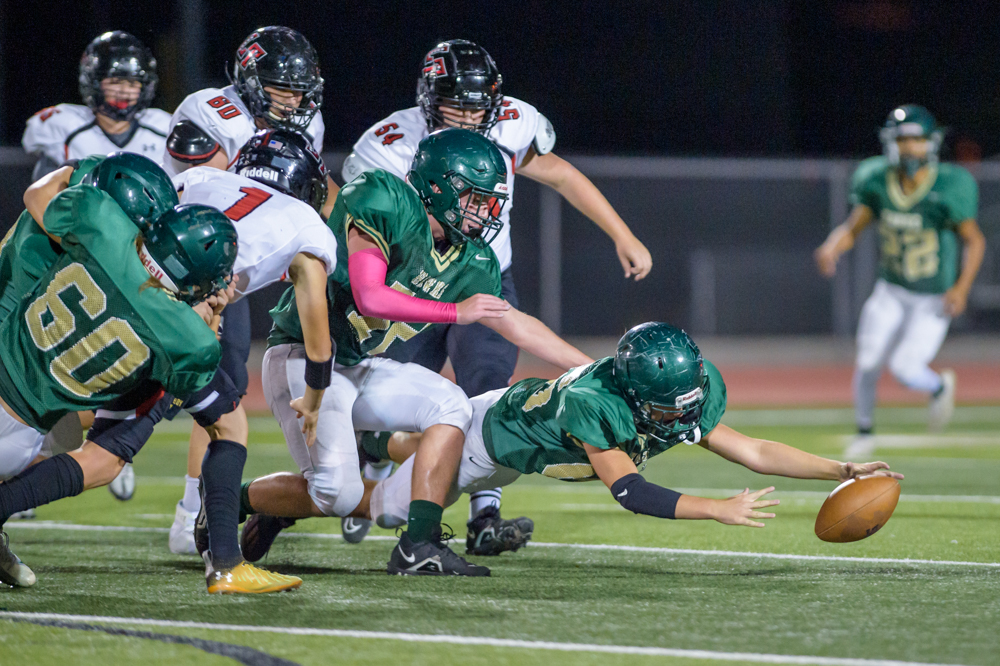
Canyon Lake recovering a fumble during last season’s Wimberley game!
(photo by Dan Reed Photography https://www.danreedphotography.com)
Career                   RUSHING STATS                         Season
Zach Henshaw         4324              Zach Henshaw      2070   2011
Tanner Faris         3058              Josh DeVries      1389   2014
James Bates          2437              Helijah Johnson   1307   2022
Helijah Johnson      2286              McGuire Johnson   1306   2013
Josh DeVries         2104              Zach Henshaw      1227   2010
Hayden Dubois        1963              Tanner Faris      1206   2016
Tristan Chacon       1934              Zach Henshaw      1135   2009
Micah St. John       1915              Tristan Chacon    1071   2017
Eduardo Covarrubias  1711              James Bates       1009   2019
Jacob Ruff           1702              Austin Brennan    1006   2016

Game Rushing                           Touchdowns for a Season
Zach Henshaw      300  Billies  2011   Zach Henshaw        25   2011
Zach Henshaw      297  Sealy    2011   Josh DeVries        17   2014
Zach Henshaw      287  Gonzales 2011   Hayden Dubois       17   2014
Helijah Johnson   277  Davenprt 2022   Helijah Johnson     15   2022
Zach Henshaw      266  Somerset 2010   Micah St. John      14   2016
Zach Henshaw      252  A Travis 2011   Jesse Horner        13   2020
Shayne Moss       243  Jodanton 2020   Jacob Ruff          13   2018
Zach Henshaw      243  Burnet   2010   Hunter Anderson     12   2022
Zach Henshaw      233  Burnet   2011   Austin Brennan      12   2016
James Bates       223  Smthvile 2019   Zach Henshaw        11   2010
                                       Zach Henshaw        11   2009
                                       James Bates         11   2019

                         RECEIVING STATS
Career             rec   yr            Season           rec yds   yr
Eric Nelson        97  1527            Eric Nelson      62  925   09
Matt Magness       50  1041            Daniel Camarillo 29  615   12
Tanner Faris       31   781            Eric Nelson      35  602   08
Jeremy Greene      33   696            Matt Magness     29  560   10
Drew Riccio        34   687            Richard Howell   31  519   10
Doug Hubnik        28   645            Doug Hubnik      22  517   12
Danniel Camarillo  29   617            Matt Magness     21  481   11
Richard Howell     32   533            Quinn Pike       18  384   11
Jeremy Fulton      38   515            Joe Shone        31  379   09
Zach Henshaw       28   509            Drew Riccio      34  365   09

Receiving Touchdowns  Career
Matt Magness       16
Eric Nelson        13
Tanner Faris        9
Doug Hubnik         8
Jeremy Greene       7
Chase Anderson      6
Daniel Camarillo    6
Austin Brennan      5
Tristan Chacon      5
Kyle Yuill          4
Christian Pena      4


Touchdowns Rushing                      Total Touchdowns
Zach Henshaw       47                   Zach Henshaw      51
Tanner Faris       32                   Tanner Faris      41
Tristan Chacon     28                   Tristan Chacon    32
Helijah Johnson    27                   Helijah Johnson   29
Hayden Dubois      26                   Josh DeVries      29
Micah St. John     24                   Hayden Dubois     26
Josh DeVries       23                   Austin Brennan    25
James Bates        23                   James Bates       25
Austin Brennan     20                   Micah St. John    24
Jacob Ruff         16                   Eric Nelson       18

                          QUARTERBACK

Passing            Comp   Att   Pct    Yds   Int  TD
Ross Wagliardo     308    559  .551   3896   20   25
Brandon Belcher    172    339  .507   3101   10   28
Peyton McMullen    116    288  .403   2500   11   22
Ben Fulton         101    299  .483   2165   10   27
Jeffrey Nabos      135    272  .495   1709   12   16
Hunter Anderson     99    184  .538   1403    6   15
Skylar Tschoepe     61    128  .476   1081    5    7

All-Time Rushing   Att    Yds   Ave   Lg   TD
Peyton McMullen    130    596   4.6   72    5
Ben Fulton         139    530   3.8   37    4
Hunter Anderson    117    524   4.8   54   16
Branson Belcher    106    241   2.3   36   10
Skyler Tschoepe     81    189   2.3   29    3

                    W    L    Pct
Ben Fulton         21   15   .583
Hunter Anderson    13    9   .579
Branson Belcher    11    9   .550
Peyton McMullen    18   15   .545
Skylar Tschopep     9   15   .375
Ross Wagliardo      7   14   .333
Jeff Nabors         6    6   .500
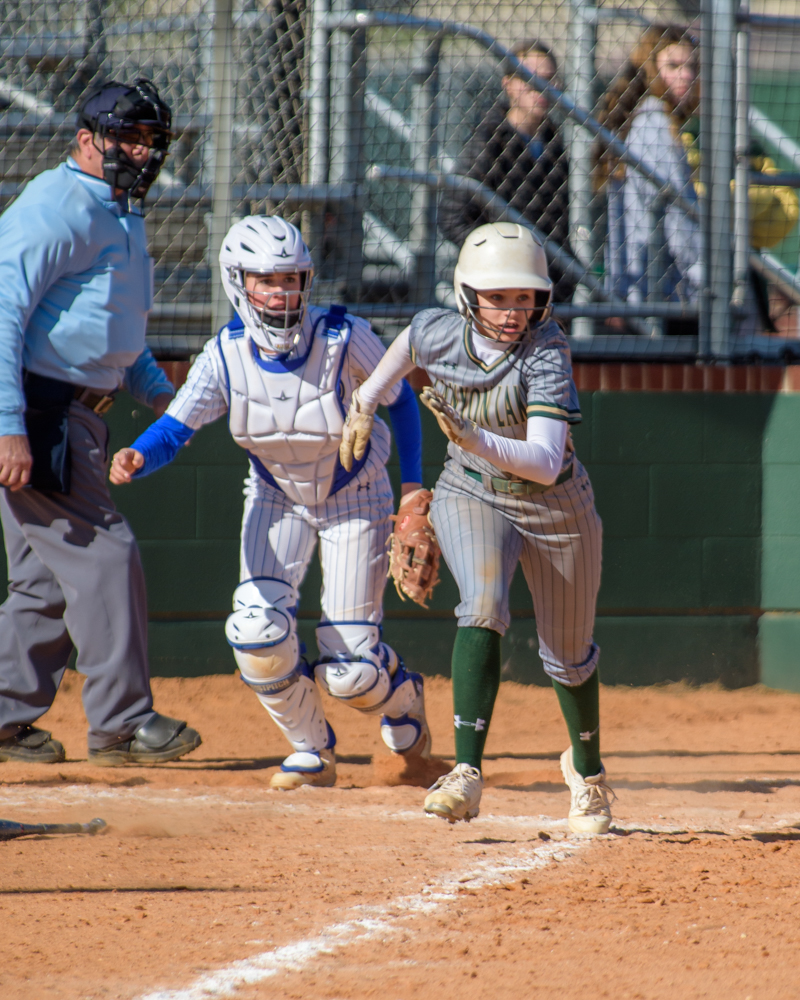
CL Lady Hawks Softball All-Time and Season Records. Way to Go Hawks!!
(photo by Dan Reed Photography https://www.danreedphotography.com)
ALL-TIME SOFTBALL STATS CAREER AT BATS SEASON Alexis Robinson 360 Alexis Robinson 111 ‘13 Kat Weber 329 Kelsey Ahrens 108 ‘13 Kelsey Ahrens 328 Vicky Henderson 106 ‘13 Carley Dubois 327 McKenna Beseda 105 ‘13 Bailey Bryan 313 Carley Dubois 97 ‘14 Maddy Puente 289 Riley Glenn-Millhouse 96 ’22 Vicky Henderson 289 Kelsey Ahrens 93 ‘14 McKenna Beseda 274 Maddy Puente 91 ‘18 Marley Carrizales 260 Maggie Banks 89 ‘18 Missy Romero 251 Alexis Robinson 89 ‘14 RUNS Alexis Robinson 117 Gabby Barnes 53 ’22 Bailey Bryan 114 Alexis Robinson 40 ‘14 Carley Dubois 105 Bailey Bryan 39 ‘18 Marley Carrizales 99 Carley Dubois 37 ‘14 Kirsten Jones 89 Carley Dubois 36 ‘17 Gabby Barnes 84 Bailey Bryan 35 ‘19 McKenna Beseda 80 Marley Carrizales 33 ‘19 Missy Romero 77 McKenna Beseda 31 ‘13 Kelsey Ahrens 73 Marley Carrizales 30 ‘17 Kenzie Sayles 72 Bailey Bryan 30 ‘17 Riley Glenn-Millhouse 30 ’22 HITS Carley Dubois 149 Marley Carrizales 51 ‘19 Bailey Bryan 139 McKenna Beseda 48 ‘13 Alexis Robinson 135 Gabby Barnes 48 ’22 Marley Carrizales 132 Riley Glenn-Millhouse 44 ’22 Maddy Puente 115 Carley Dubois 44 ‘16 Kelsey Ahrens 109 Bailey Bryan 42 ‘18 McKenna Beseda 103 Kelsey Ahrens 39 ‘13 Gabby Barnes 91 Carley Dubois 39 ‘14 Missy Romero 90 Alexis Robinson 38 ‘14 Riley Glenn-Millhouse 89 Alexis Robinson 38 ‘13 RBIs Bailey Bryan 100 Riley Glen-Millhouse 44 ’22 Maddy Puente 99 Bailey Bryan 41 ‘18 Alexis Robinson 94 Brianna Young 33 ‘14 Kelsey Ahrens 76 Maddy Puente 30 ‘17 Brianna Young 75 Alexis Robinson 30 ‘14 Riley Glenn-Millhouse 72 Maddy Puente 30 ‘18 Kat Weber 64 Alexis Robinson 28 ‘16 Lauren Mentzer 59 Bailey Bryan 27 ‘17 Missy Romero 55 Bailey Bryan 26 ‘19 Shelby Porter 52 Kelsey Ahrens 26 ‘15 Carley Dubois 50 Kelsey Ahrens 26 ‘14 Adriana Peaslee 50 BASE on BALLS Bailey Bryan 56 Emma Lane 27 ’22 Missy Romero 55 Brianna Young 24 ‘13 Brianna Young 53 Alexis Robinson 24 ‘14 Alexis Robinson 52 Missy Romero 21 ‘11 Emma Lane 43 Bailey Bryan 21 ‘18 Carley Dubois 39 Kelsey Ahrens 19 ‘15 Kat Weber 39 Marley Carrizales 19 ‘19 Marley Carrizales 38 Jaden Castillo 18 ’22 Kelsey Ahrens 35 Brianna Young 16 ‘16 Madison Hartman 29 Bailey Bryan 16 ‘19 Adriana Peaslee 29 Madison Hartman 16 ’22 STOLEN BASES Carley Dubois 92 Carley Dubois 32 ‘16 Marley Carrizales 53 Gabby Barnes 26 ’22 Gabby Barnes 48 McKenna Beseda 24 ‘13 Kirsten Jones 45 Carley Dubois 23 ‘17 McKenna Beseda 42 Carley Dubois 19 ‘14 Bailey Bryan 41 McKenna Beseda 18 ‘12 Tiffany Arredondo 39 Carley Dubois 18 ’15 Vicky Henderson 27 Gabby Barnes 18 ‘23 Jodi Glenn-Millhouse 26 Kirsten Jones 17 ‘16 Alex Henderson 25 Tiffany Arredondo 17 ‘11 Marley Carrizales 17 ‘17 DOUBLES Maddy Puente 33 Gabby Barnes 14 ’22 Alexis Robinson 27 Maddy Puente 13 ‘18 Missy Romero 24 Bailey Bryan 13 ’19 Brianna Young 24 Cheyenne Fields 11 ‘23 Kelsey Ahrens 24 Riley Glenn-Millhouse 11 ’22 Bailey Bryan 23 Lauren Mentzer 11 ‘16 Gabby Barnes 21 Kelsey Ahrens 10 ’13 Emma Lane 20 Shelby Porter 10 ‘23 Riley Glenn-Millhouse 19 Missy Romero 9 ‘11 Adriana Peaslee 18 Brianna Young 8 ’13 TRIPLES Alexis Robinson 15 Missy Romero 7 ‘09 Missy Romero 9 Alexis Robinson 6 ‘14 Gabby Barnes 8 Bailey Bryan 4 ’19 Kenzie Sayles 7 Gabby Barnes 4 ‘23 Bailey Bryan 6 Gabby Barnes 3 ’22 Kaylee Puente 6 Alexis Robinson 3 ‘15 Maddy Puente 5 Jessie Melendez 3 ‘19 Jessie Melendez 5 Jessie Melendez 3 ‘18 Carley Dubois 4 Kaylee Puente 3 ‘18 Alysa Johnson 4 Kenzie Sayles 3 ‘18 Kelsey Ahrens 4 Maddy Puente 3 ‘18 HOME RUNS Bailey Bryan 14 Bailey Bryan 9 ‘18 Alexis Robinson 11 Gabby Barnes 6 ’22 Maddy Puente 8 Alexis Robinson 5 ‘14 Shelby Porter 7 Bailey Bryan 4 ‘19 Kelsey Ahrens 6 Kelsey Ahrens 4 ‘15 Gabby Barnes 6 Maddy Puente 4 ’17 Brianna Young 4 Shelby Porter 4 ’23 Adriana Peaslee 3 Shelby Porter 3 ’22 Maggie Banks 3 Maggie Banks 3 ‘18 Angie Rodriguez 3 Kelsey Ahrens 3 ‘14 HIT by PITCH Shelby Porter 11 Marley Christian 9 Kat Weber 8 Emma Lane 7 Adriana Teutsch 7 Megan Browning 7 Madison Hartman 7 Marley Carrizales 6 Carley Dubois 6 Riley Glenn-Millhouse 6 Adriana Peaslee 6 (100 or more Plate Appearances) BATTING AVERAGE Marley Carrizales .508 Marley Carrizales .600 ‘19 Carley Dubois .456 Adriana Peaslee .553 ‘19 Gabby Barnes .447 Gabby Barnes .552 ’22 Alysa Johnson .445 Carley Dubois .543 ‘16 Bailey Bryan .444 Marley Carrizales .542 ‘18 Riley Glenn-Millhouaw .424 Bailey Bryan .538 ‘18 Adriana Peaslee .399 Marley Carrizales .531 ‘17 Maddy Puente .398 Kirsten Jones .468 ‘16 McKenna Beseda .376 Riley Glenn-Millhouse .458 ’22 Alexis Robinson .375 McKenna Beseda .457 ‘13 ON BASE PERCENTAGE Marley Carrizales .579 Bailey Bryan .654 ‘18 Bailey Bryan .532 Marley Carrizales .642 ‘19 Carley Dubois .523 Marley Carrizales .640 ‘18 Gabby Barnes .515 Adriana Peaslee .625 ‘19 Alysa Johnson .495 Gabby Barnes .610 ’22 Brianna Young .485 Marley Carrizales .600 ’17 Adriana Peaslee .481 Marley Christian .600 ‘23 Missy Romero .479 Carley Dubois .583 ‘16 Rianna Gonzales .467 Kirsten Jones .581 ‘16 Emma Lane .466 Carley Dubois .571 ’17 SLUGGING PERCENTAGE Gabby Barnes .697 Gabby Barnes .989 ’22 Bailey Bryan .690 Bailey Bryan .974 ‘18 Maddy Puente .639 Alexis Robinson .966 ‘14 Alexis Robinson .625 Missy Romero .821 ‘12 Alysa Johnson .615 Bailey Bryan .800 ‘19 Riley Glenn-Millhouse .581 Adriana Peaslee .702 ‘19 Missy Romero .550 Riley Glenn-Millhouse .699 ’22 Shelby Porter .549 Gabby Barnes .690 ‘23 Marley Carrizales .534 Maddy Puente .675 ‘17 Carley Dubois .532 Marley Carrizales .671 ’19 Adriana Peaslee .524 Shelby Porter .671 ’23 PITCHING INNINGS PITCHED Alexis Robinson 528.1 Missy Romero 498.1 Maddy Puente 250.1 Lauren Mentzer 225.0 Gabby Barnes 216.2 Maggie Banks 157.2 Kenzie Sayles 146.1 Rianna Gonzales 87.1 Aubrey Long 53.1 EARNED RUN AVERAGE (35 or more innings) Missy Romero 2.77 Maggie Banks 0.69 ‘16 Alexis Robinson 3.35 Missy Romero 1.05 ‘12 Lauren Mentzer 3.52 Missy Romero 1.23 ‘11 Maggie Banks 3.78 Lauren Mentor 1.89 ‘16 Aubrey Long 4.09 Alexis Robinson 1.94 ‘16 Maddie Puente 5.12 Maggie Banks 2.75 ‘17 Gabby Barnes 5.70 Alexis Robinson 3.17 ‘13 Rianna Gonzales 7.07 Maddy Puente 3.19 ‘17 Kenzie Sayles 7.76 Lauren Mentzer 3.26 ‘17 Gabby Barnes 3.43 ’22 WINS Missy Romero 41 Maggie Banks 16 ‘18 Alexis Robinson 40 Missy Romero 15 ‘11 Lauren Mentzer 22 Missy Romero 12 ‘12 Maggie Banks 21 Gabby Barnes 11 ’22 Maddy Puente 21 Lauren Mentzer 9 ‘17 Gabby Barnes 18 Missy Romero 8 ‘09 Kenzie Sayles 9 Alexis Robinson 8 ‘13 Rianna Gonzales 7 Alexis Robinson 6 ‘16 Aubrey Long 5 Rianna Gonzales 5 ’22 Maddy Puente 5 ’17 STRIKEOUTS Alexis Robinson 682 Missy Romero 641 Gabby Barnes 292 Lauren Mentzer 258 Maddy Puente 218 Kenzie Sayles 109 Maggie Banks 103 Rianna Gonzales 55 Aubrey Long 38 SAVES Maggie Banks 10 Maddy Puente 4 Alexis Robinson 2 Gabby Barnes 2 Lauren Mentzer 1 WALKS per INNING PITCHED Missy Romero 0.22 Maggie Banks 0.29 Lauren Mentzer 0.50 Maddy Puente 0.58 Aubrey Long 0.58 Gabby Barnes 0.71 Kenzie Sayles 0.71 Alexis Robinson 0.76 Rianna Gonzales 0.81
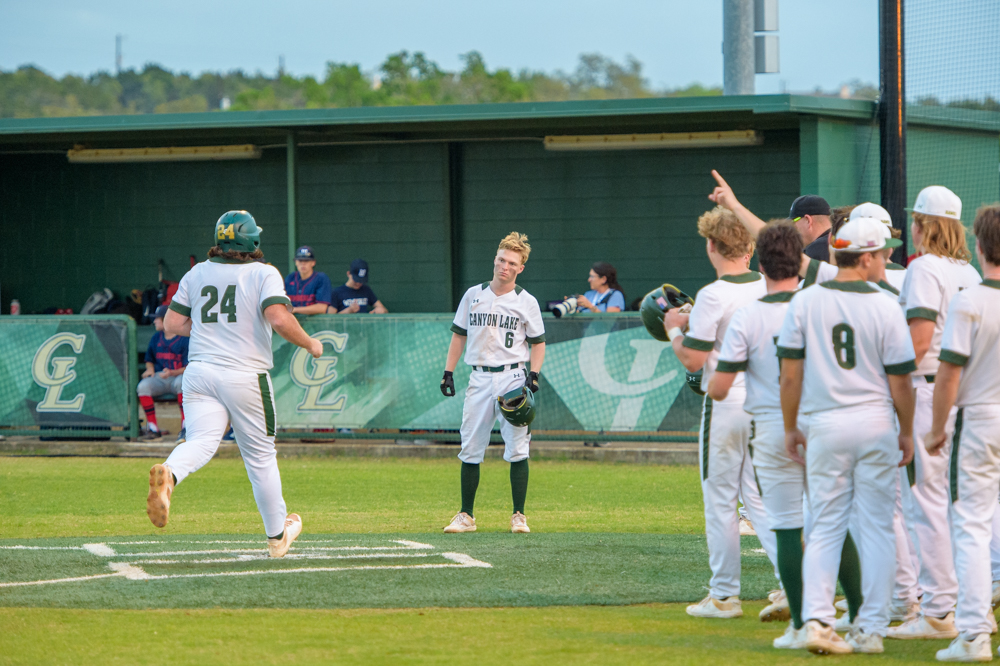
Griffen Williams hit 3 more home runs than his Jersey #….wish he would have chosen #35. Way to Go Hawks!
(photo by Dan Reed Photography https://www.danreedphotography.com)
ALL-TIME BASEBALL STATS CAREER AT BATS SEASON Hunter Anderson 373 Tyler Pauly 104 ’21 Chase Anderson 353 Chase Anderson 104 ’22 Tanner Schultz 343 Carter Williams 104 ’23 Griffen Williams 323 Hunter Anderson 100 ’23 Travis Walker 322 Hunter Anderson 97 ’22 Caleb Williams 318 Griffen Williams 95 ’22 Ty Sellers 306 Chase Anderson 93 ’23 Tyler Pauly 281 Hunter Anderson 93 ’21 Cody Powell 245 Tanner Schultz 91 ’21 Michael Brady 239 Chase Anderson 86 ’21 RUNS Hunter Anderson 91 Hunter Anderson 31 ’23 Chase Anderson 68 James LaLonde 29 ’21 Travis Walker 65 Tyler Pauly 29 ’21 Ty Sellers 57 Hunter Anderson 29 ’22 Caleb Williams 54 Brody Ross 29 ’22 James LaLonde 54 Hunter Anderson 26 ’21 Jeremy Greene 46 Chase Anderson 26 ’23 Griffen Williams 44 Ty Sellers 24 ’22 Garrett Winters 44 Matthew McLain 23 ’21 Tyler Pauly 44 Carter Williams 23 ’23 HITS Chase Anderson 122 Chase Anderson 47 ’22 Hunter Anderson 112 Griffen Williams 43 ’22 Griffen Williams 104 Hunter Anderson 41 ’23 Tanner Schultz 82 Chase Anderson 37 ’21 Travis Walker 80 Hunter Anderson 37 ’22 Caleb Williams 77 Tyler Pauly 36 ’21 Tyler Pauly 75 Griffen Williams 34 ’23 Brandon Robinson 72 Chase Anderson 34 ’23 Ty Sellers 68 Carter Williams 32 ’23 Michael Brady 67 Matthew McLain 32 ’21 Tanner Schultz 32 ’21 RBIs Griffen Williams 126 Griffen Williams 46 ’22 Tyler Pauly 61 Griffen Williams 42 ’23 Chase Anderson 55 Griffen Williams 38 ’21 Tanner Schultz 53 Tyler Pauly 33 ’21 Hunter Anderson 49 Carter Williams 32 ’23 Ty Sellers 48 Ty Sellers 22 ’22 Travis Walker 44 Chase Anderson 22 ’21 Caleb Williams 44 Tanner Schultz 20 ’22 Logan Felch 42 Jeremy Greene 20 ’22 Brandon Robinson 40 Logan Felch 19 ’12 Matt McLain 19 ’21 Hunter Anderson 19 ’21 BASE on BALLS Tyler Pauly 63 Tyler Pauly 36 ’21 Hunter Anderson 55 Griffen Williams 27 ’23 Matt Anderson 54 Matthew McLain 23 ’21 Griffen Williams 51 Hunter Anderson 20 ’23 Michael Brady 48 Jeremy Greene 20 ’22 Chase Anderson 48 Michael Brady 19 ’13 Travis Walker 39 Matt Anderson 19 ’19 Caleb Williams 38 Hunter Anderson 19 ’21 Daulton Winters 37 Tyler Pauly 18 ’20 Brayden Welch 34 Tanner Schultz 18 ’21 James LaLonde 18 ’21 Chase Anderson 18 ’23 STOLEN BASES Daniel Camarillo 29 Drew Riccio 17 ’10 Hunter Anderson 25 Eric Nelson 13 ’10 Caleb Williams 23 Daniel Camarillo 13 ’11 Joe Shone 23 James LaLonde 13 ’21 Tyler Pauly 23 Tyler Pauly 13 ’21 James LaLonde 20 Joe Shone 12 ’10 Jeremy Greene 20 Garrett Winters 11 ’15 Mason Lee 16 Nick Cahill 11 ’15 Chase Anderson 16 Caleb Williams 11 ’19 Brandon Robinson 15 Brandon Robinson 11 ’19 DOUBLES Griffen Williams 21 Tyler Pauly 12 ’21 Travis Walker 19 Griffen Williams 11 ’22 Hunter Anderson 19 Hayden Baker 11 ’23 Chase Anderson 17 Chase Anderson 9 ’22 Hayden Baker 17 Tanner Schultz 8 ’21 Tanner Schultz 17 Travis Walker 7 ’12 Tyler Pauly 17 Michael Brady 7 ’13 Corey Shedrock 16 Hunter Anderson 7 ’22 Logan Felch 14 Hunter Anderson 7 ’23 Michael Brady 13 Matthew McLain 6 ’21 Griffen Williams 6 ’21 Cody Breest 6 ’09 Logan Felch 6 ’11 Joe Shone 6 ’10 TRIPLES Kyler Huff 6 Kyler Huff 4 ’13 Hunter Anderson 5 Ty Sellers 4 ’22 Caleb Williams 4 Hunter Anderson 3 ’23 Ty Sellers 4 Gavin Dietrich 3 ’16 Cody Powell 3 Hunter Anderson 2 ’22 Gavin Dietrich 3 Caleb Williams 2 ’20 Daniel Camarillo 3 Caleb Williams 2 ’19 Tyler Pauly 3 Brandon Robinson 2 ’19 9 Tied with 2 Chase Anderson 2 ’21 Tanner Schultz 2 ’21 Tyler Pauly 2 ’21 TJ Jones 2 ’14 Daniel Camarillo 2 ’13 HOME RUNS Griffen Williams 27 Griffen Williams 12 ’23 Carter Williams 7 Griffen Williams 9 ’22 Travis Walker 6 Carter Williams 7 ’23 Logan Felch 6 Griffen Williams 6 ’21 Jeremy Greene 4 Jeremy Greene 3 ’22 Cody Breest 4 Nick Cahill 3 ’14 Nick Cahill 4 Travis Walker 3 ’12 Joe Shoe 4 9 players with 2 Ty Sellers 3 Brandon Robinson 3 Tanner Schultz 3 HIT by PITCH Tanner Schultz 21 Matt Anderson 15 Ethan Slater 13 Brandon Robinson 12 CJ Parrish 12 Griffen Williams 12 Jeremy Greene 12 Tanner Sellers 10 Ty Sellers 10 (100 or more Plate Appearances) BATTING AVERAGE Matthew McLain .421 Griffen Williams. .453 ’22 Griffen Williams .402 Chase Anderson .452 ’22 Chase Anderson .401 Travis Walker .435 ‘10 Brandon Robinson .398 Chase Anderson .430 ’21 Michael Brady .364 Matthew McLain .421 ’21 Hunter Anderson .362 Brandon Robinson .418 ’20 Nich Cahill .354 Michael Brady .413 ‘13 Tyler Pauly .344 Brandon Robinson .413 ’19 Ross Wagliardo .339 Hunter Anderson .410 ’23 Zach Jenkins .336 Griffen Williams .405 ’23 ON BASE PERCENTAGE Matthew McLain .581 Matthew McLain .581 ’21 Griffen Williams .519 Griffen Williams .565 ’23 Michael Brady .510 Matt Anderson .543 ‘20 Brandon Robinson .505 Griffen Williams .540 ’22 Tyler Pauly .498 Michael Brady .537 ‘13 Chase Anderson .490 Brandon Robinson .536 ’20 Matt Anderson .489 Tyler Pauly .525 ’20 Tyler Pauly .481 Tyler Pauly .518 ‘21 Jeff Nabors .475 Travis Walker .518 ’12 Zach Jenkins .472 Hunter Anderson .516 ’23 SLUGGING PERCENTAGE Griffen Williams .811 Griffen Williams .905 ’23 Carter Williams .548 Griffen Williams .874 ’22 Matthew McLain .539 Griffen Williams .650 ’21 Brandon Robinson .519 Ty Sellers .582 ’22 Joe Shone .505 Brandon Robinson .573 ’19 Tyler Pauly .493 Hunter Anderson .570 ’23 Nick Cahill .485 Chase Anderson .567 ’22 Chase Anderson .480 Brandon Robinson .564 ‘20 Hunter Anderson .466 Corey Shedrock .558 ‘15 Ross Wagliardo .446 Michael Brady .553 ’13 Michael Brady .446 PITCHING INNINGS PITCHED Tanner Schultz 224.0 Tyler Pauly 149.1 Avery Montgomery 142.0 Griffen Williams 138.2 Cody Powell 114.1 Hunter Anderson 110.0 Luke Roskin 105.2 Matt Anderson 99.0 Ross Wagliardo 96.1 Logan Felch 93.2 EARNED RUN AVERAGE (35 or more innings) Peyton McMullen 1.44 Tyler Pauly 1.71 Luke Roskin 1.89 Hunter Anderson 2.02 Tanner Schultz 2.38 Cody Breest 2.48 Griffen Williams 2.76 Zach Jenkins 3.03 Cale Claycomb 3.17 Cody Powell 3.62 WINS Tanner Schultz 29 Tyler Pauly 18 Hunter Anderson 15 Luke Roskin 14 Cody Breest 11 Griffen Williams 9 Avery Montgomery 8 Cody Powell 7 Matt Anderson 6 Ross Wagliardo 5 Cale Claycomb 5 Zach Jenkins 5 Hayden Baker 5 STRIKEOUTS Tanner Schultz 226 Tyler Pauly 190 Griffen Williams 143 Luke Roskin 132 Cody Powell 128 Hunter Anderson 111 Ross Wagliardo 109 Avery Montgomery 108 Cale Claycomb 105 Matt Anderson 89 SAVES John Gulley 4 Luke Roskin 4 Kyler Huff 3 Hunter Anderson 3 Peyton McMullen 3 Griffen Williams 3 Cale Claycomb 2 Cody Breest 2 Ross Wagliardo 2 Drew Tyra 2 Matt Anderson 2